
The Sisense Platform
Integrate customized analytics into your applications and products with Sisense Fusion Embed. Share intuitive insights allowing users to make confident, data-informed decisions. Boost product engagement and adoption, and customer acquisition and retention with the competitive advantage of our AI-driven, low/no code, embedded analytics application.
- Accelerate time to market
- Build scalable native applications
- Enhance analytics experiences for your customers

Embed analytics in a code-first, scalable, modular way with Sisense Compose SDK, our flexible developer toolkit. Build analytics and insight-driven experiences into your products faster, reduce maintenance burden, and save development time over coding from scratch.
- Build faster with components purpose-built for analytics
- Use with the tech stack, tools, and frameworks you already use
- Create with Sisense’s, your team’s, or any other libraries and APIs

Ditch the installation, upgrades and maintenance that come with on-premises servers. Leverage the power of the cloud to accelerate analytics and stay up-to-date with our cloud-native and cloud-agnostic analytics platform.
- Unlimited scalability
- Hassle-free maintenance
- Zero-touch upgrades
Harness the power of fusion
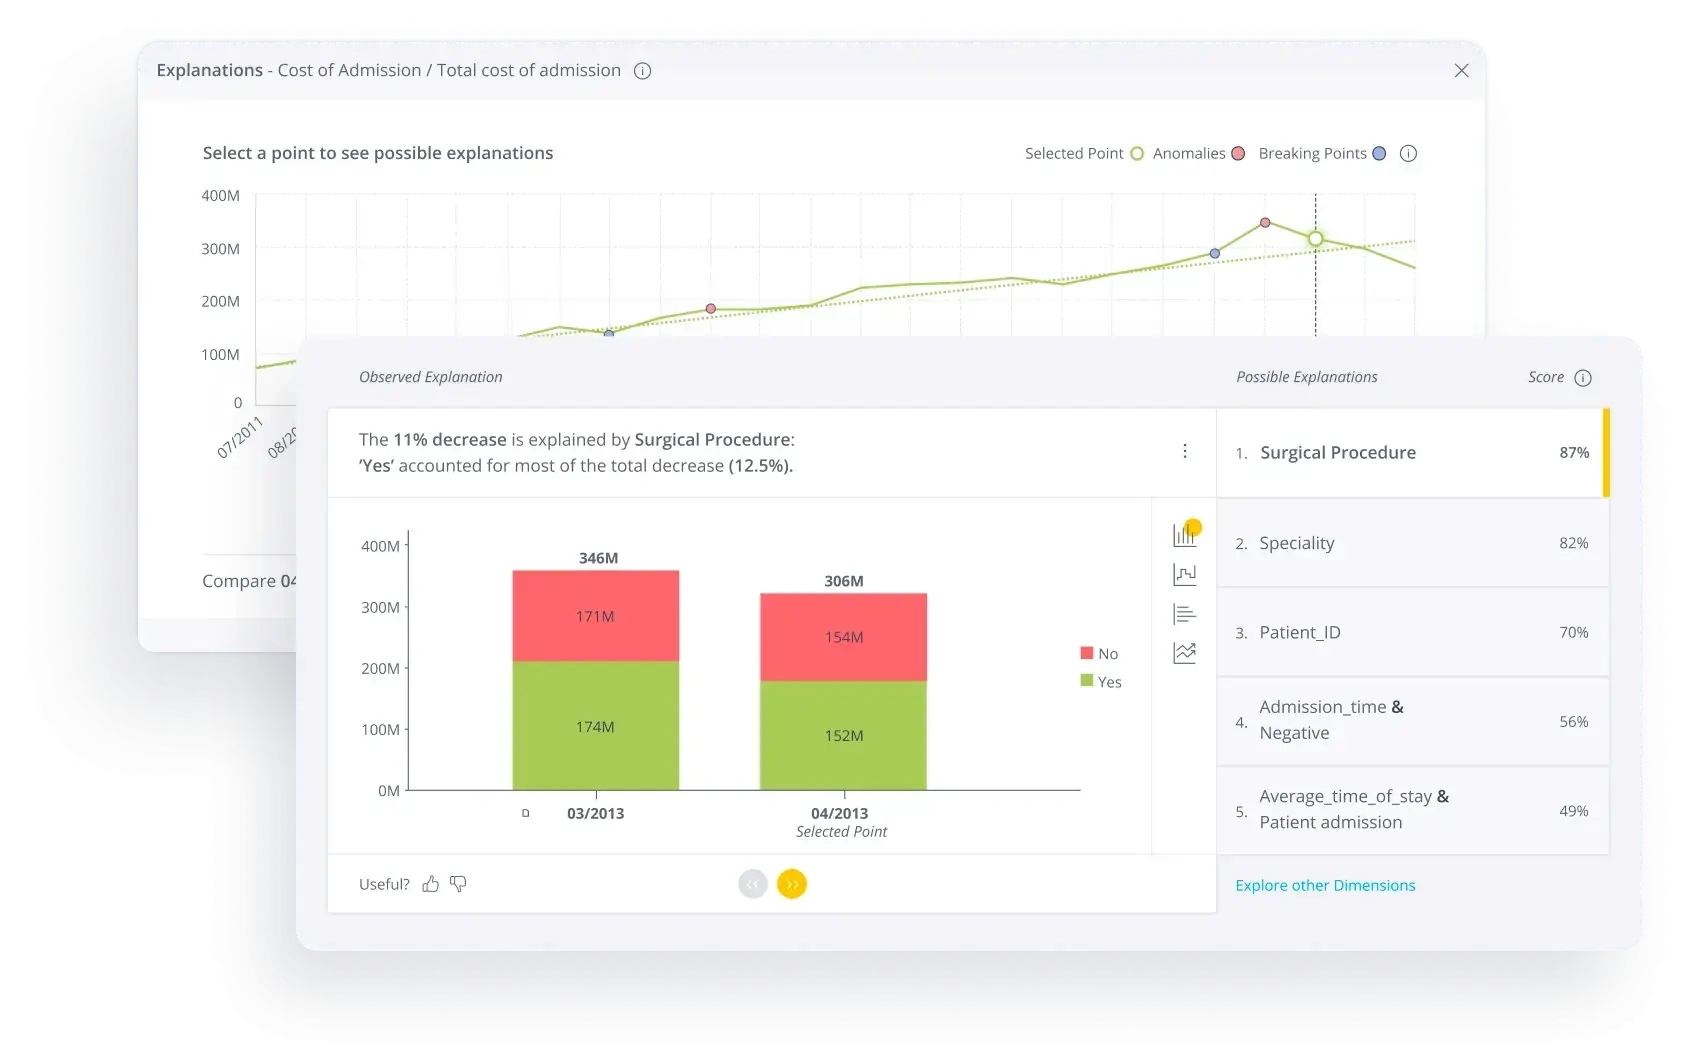
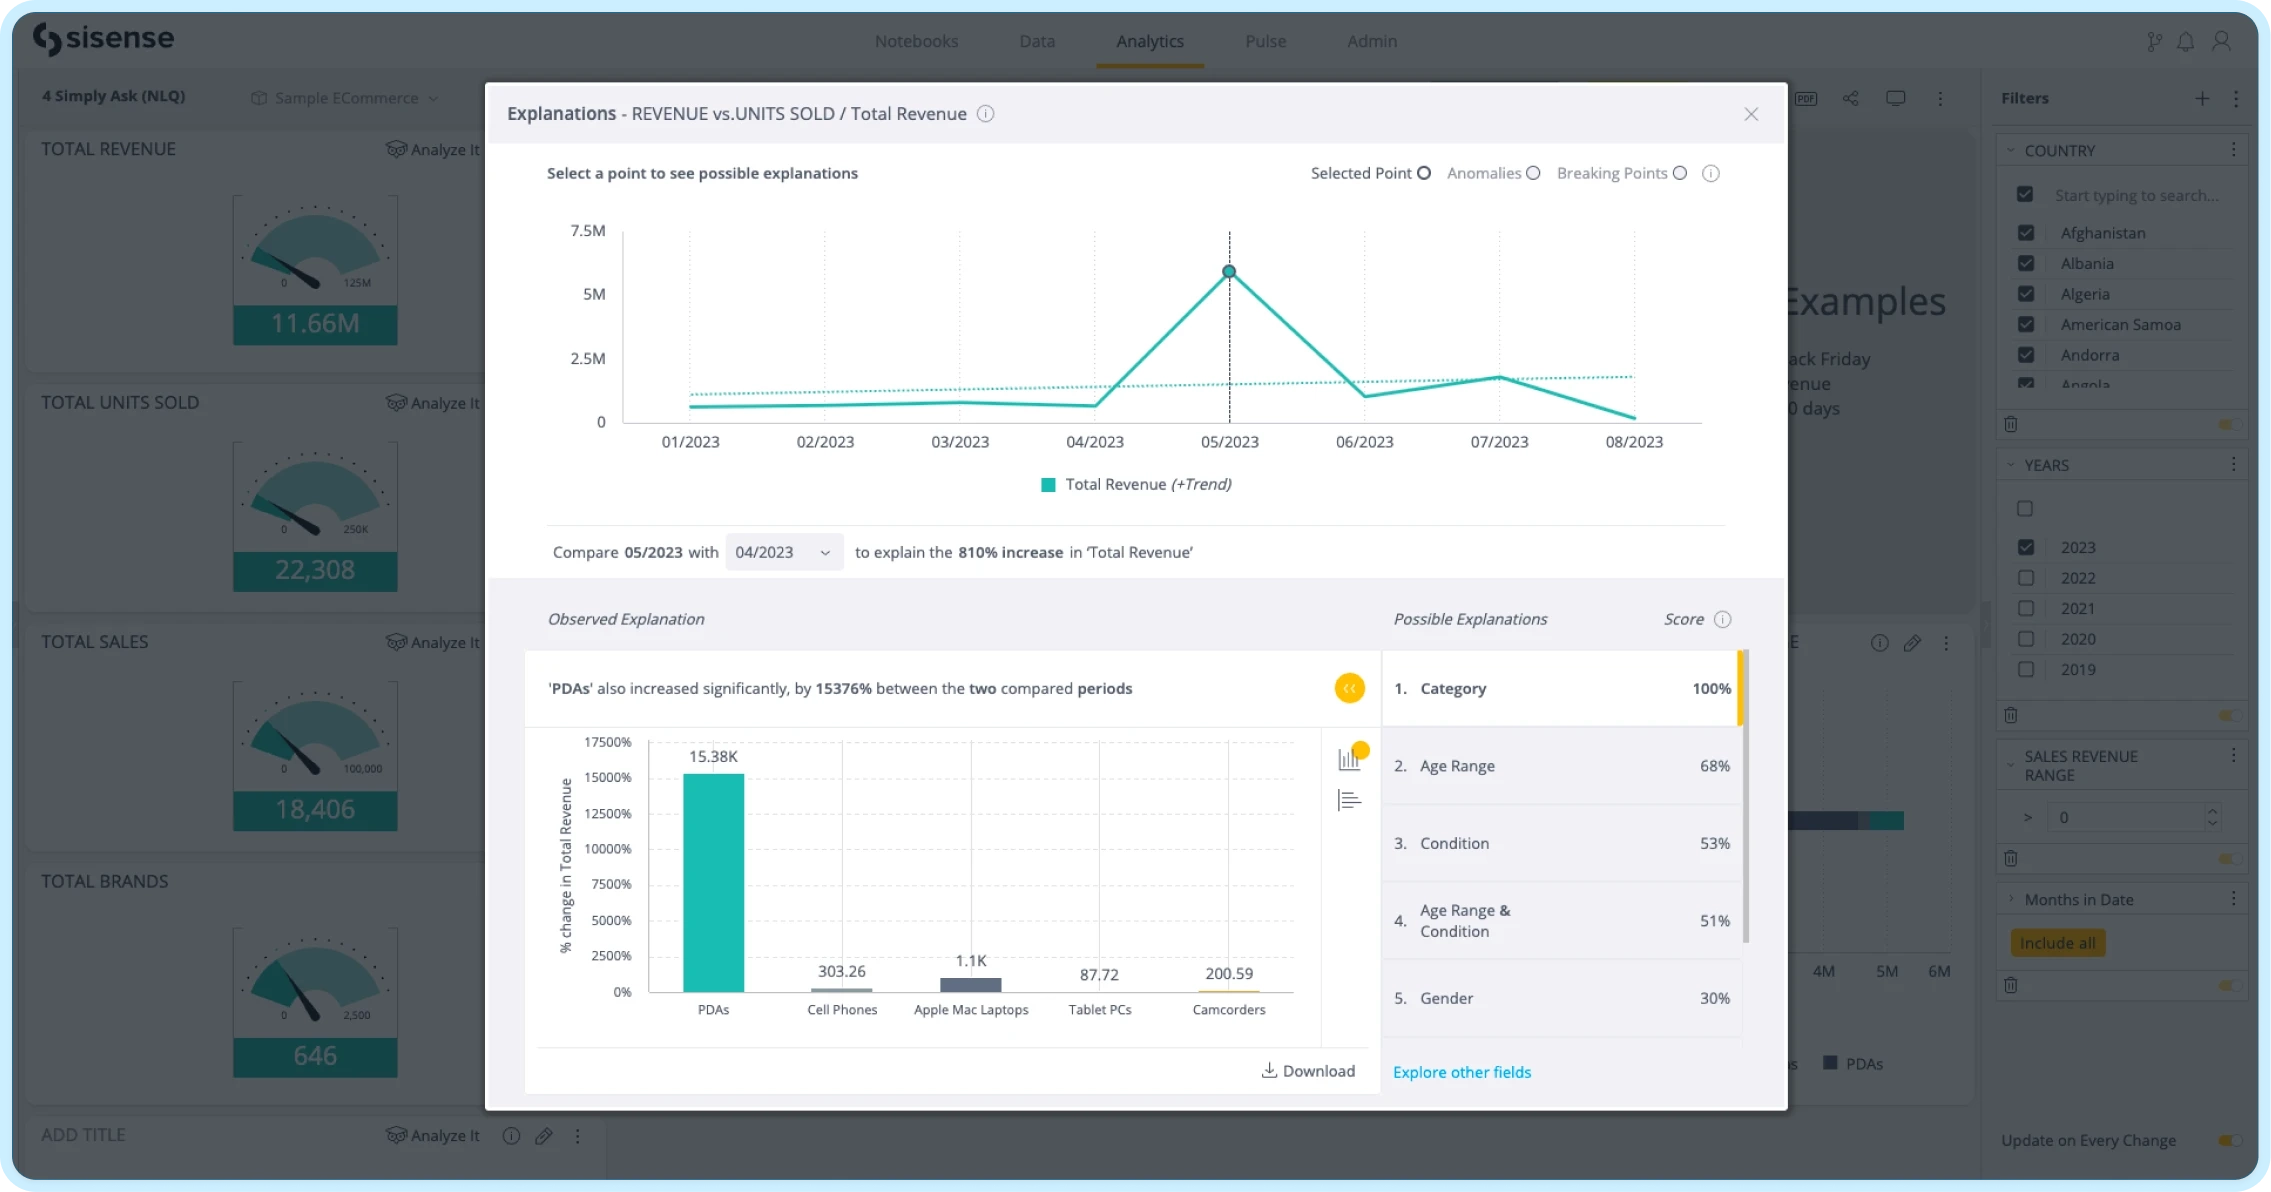
AI-driven platform
Cloud deployment flexibility
Approachable analytics

Composable and extensible
What our customers say about our platform
“At Sophos Central we are building next gen technologies from endpoint to mobile to server. With a unified management console, we deliver real-time information sharing between products and automated incident response to make cybersecurity easier and more effective. With Sisense’s Compose SDK, we are excited about having the tools to break out of the box and build new kinds of visualizations that will drive product differentiation.”
Sophos Central