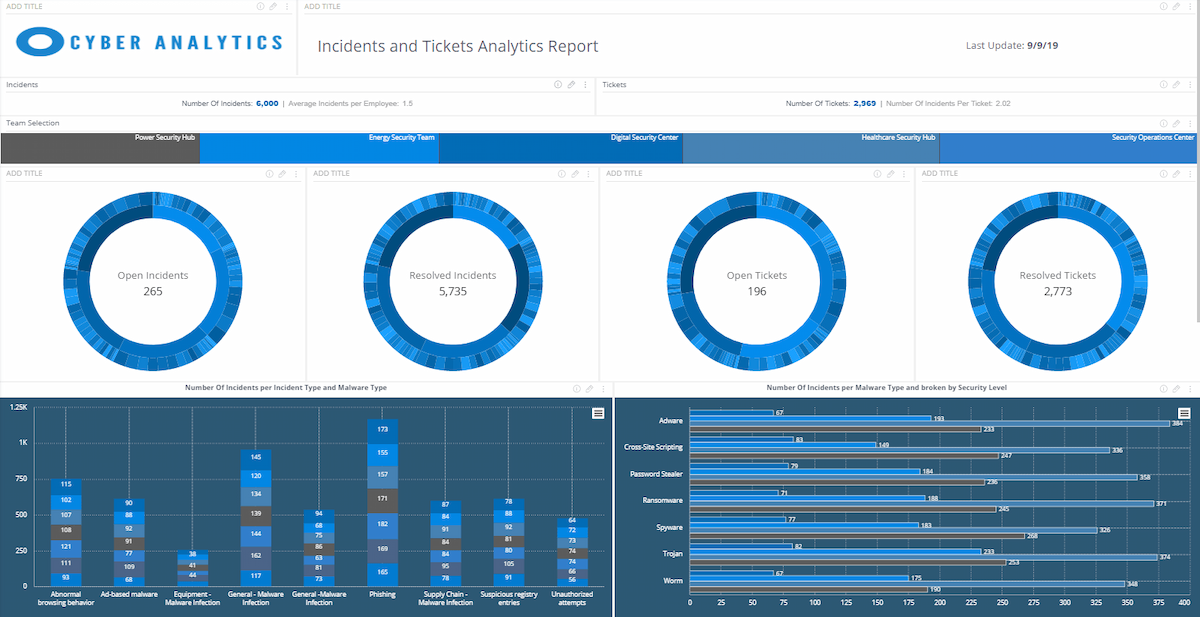
High Level Design
Overview
Today’s organizations are constantly getting attacked by cyber threats. It is important that the security officer is aware of all kinds of metrics and performance indicators where threats have occurred.Goals
Monitor and analyze overall cyber threats and response team performance in order to plan prevent actions for offices which considered to be at risk
Objectives
- Monitor Number of Security incidents and Tickets over time
- Monitor Number of Incidents and Tickets by Malware Type, Risk Level, Location
- Monitor Response teamwork and Average Time to Resolution
- Discover the correlation between Number of Incidents and Security Rating
KPIs Architecture
Objective |
KPI’s |
Measures |
Data source |
|||||
Monitor Number of Security Incidents and Tickets over time |
Number of Incidents |
count([Incident ID]) |
FACT Incidents |
|||||
Average Incidents per Employee |
AVG([Employee ID],[# of unique Incident ID]) |
FACT Incidents DIM Employee |
||||||
Number of Tickets |
count([Ticket ID]) |
FACT Tickets |
||||||
Number Of Incidents per Ticket |
count([Incident ID])/[# of unique Ticket ID] |
FACT Incidents FACT Tickets |
||||||
Open Security Incidents |
(count([Incident ID]),[Status]=”Open”) |
FACT Incidents DIM Response Team |
||||||
Resolved Security Incidents |
(count([Incident ID]),[Status]=”Closed”) |
FACT Incidents DIM Response Team |
||||||
Open Tickets |
([# of unique Ticket ID],[TicketStatus]=”Open”) |
FACT Tickets DIM Response Team |
||||||
Resolved Tickets |
([# of unique Ticket ID],[TicketStatus]=”Closed”) |
FACT Tickets DIM Response Team |
||||||
Monitor Number of Incidents and Tickets by Malware Type, Risk Level, Location |
Number Of Incidents per Incident Type and Malware Type |
count([Incident ID]) |
FACT Incidents DIM Incident |
|||||
Number Of Incidents per Malware Type and broken by Risk Level |
count([Incident ID]) |
FACT Incidents DIM Incident |
||||||
Monitor Number of Incidents and Tickets by Malware Type, Risk Level, Location |
Number of Incidents per State |
count([Incident ID]) |
DIM Incident |
|||||
Discover the correlation between Number of Incidents and Security Rating |
Number Of Incidents Vs. Security Rating Over Last Quarters |
count([Incident ID]) AVG([Quarters in Date],[# of unique Incident ID]) MEDIAN([Security Rating]) |
DIM Date FACT Incidents |
|||||
Monitor Response teamwork and Average Time to Resolution |
Average Number of Incidents Per Response Team Member Over the 15 Months (Full) |
count([Incident Owner]), AVG([Team Member ID],[# of unique Incident ID]) AVG([Months in Date],AVG([Team Member ID],[# of unique Incident ID])) |
DIM Date DIM Response Team FACT Incidents |
|||||
Response Time (Days) by Sub Response Team, Broken by Risk Level |
(avg([Response Dwell ( Days)]),[Risk Level]=”Critical”) (avg([Response Dwell ( Days)]),[Risk Level]=”High”) (avg([Response Dwell ( Days)]),[Risk Level]=”Medium”) (avg([Response Dwell ( Days)]),[Risk Level]=”Low”) |
DIM Response Team FACT Incidents |
Plugins and Scripts
Blox
https://www.sisense.com/marketplace/blox-widgets/
Image Widget
https://support.sisense.com/hc/en-us/community/posts/221224568-Adding-Logo-Image-to-a-dashboard
Add Custom Palette
Widget Background Script
widget.on(‘processresult’,function(w,e){
e.result.plotOptions.series.dataLabels.style.color = “white”;
e.result.plotOptions.series.dataLabels.style.fontSize = “12px”;
e.result.plotOptions.series.dataLabels.style.fontWeight = “light”;
})
widget.on(‘domready’, function(se, ev){
$(‘.widget-body’ ,element).css(‘fill’,’#2D5874′);
$(element).css(‘background-color’,’#2D5874′);
$(‘.highcharts-axis-labels text’).css(‘fill’,’white’);
$(‘.highcharts-legend-item text’).css(‘fill’,’white’);
})