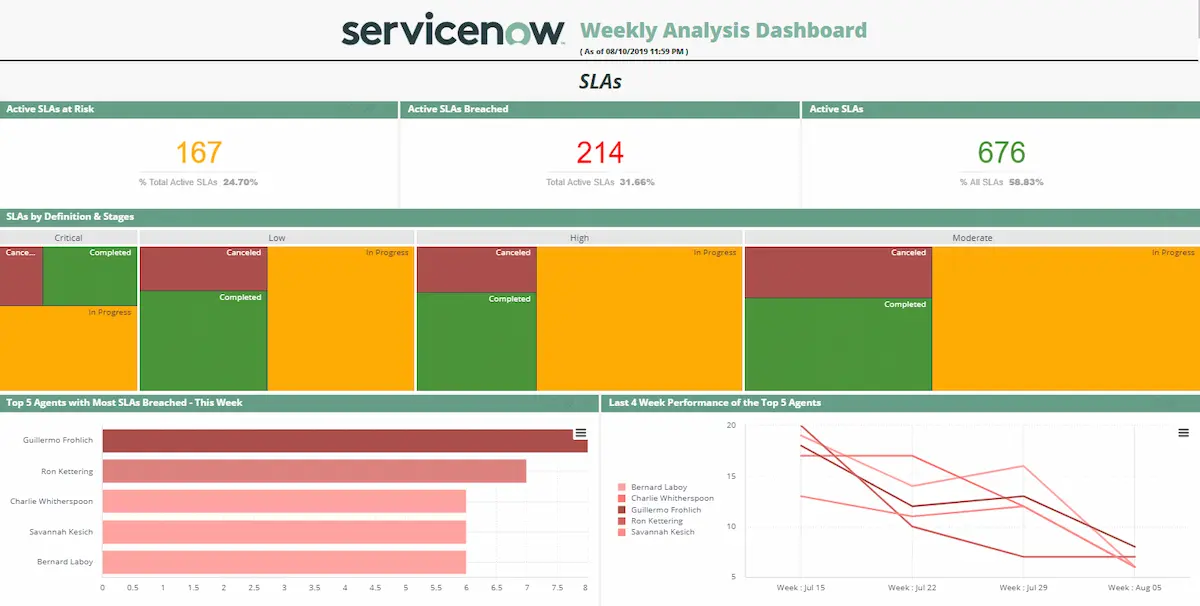
High Level Design
Overview
ServiceNow is one of the widely used IT Management systems in the world by many of the enterprise customers to have a one-stop for all their IT related activities. The major use of the application is to manage the tickets that the users create when they have an issue with their IT services or even if they want to replace any of their IT assets. Depending on the priority of the ticket or the incident, they are given an ‘expected to complete’ time-based on the Service Level Agreement (SLA).
In any organization, solving the incident before the SLA breaches is the prime responsibilities of the IT engineers who are working inhouse or the third-party company that manages the IT services/maintenance of the organization. These IT organizations also manage a lot of other applications to manage different functions of their business and there would be different teams working to making changes to the design of these applications – both frontend and backend designs.
Whenever there is a change that needs to be implemented in the Production instance of these applications, then the development team submits a change requests which would then be tested, reviewed, authorized and then implemented in the production instance by a set of admins. ServiceNow supports this process seamlessly by maintaining these stages and involving appropriate IT admins in the various stages.
Goals
To understand the current state of the different types of incidents raised by the IT users and also analyze how well the SLAs are handled by the IT agents which would give a good overview of how the team has been prioritizing and performing to the Mangers and Directors of the IT team. Also need the ability the types of change requests that need attention and are raised with the highest priority, so the business functions are not hampered by the pending change requests. This will help the various owners of the applications within the organization to take a look at this dashboard to know the weekly status.
Objectives
- Analyze how well the SLAs are handled and have a weekly check on how many SLA breaches happen
- Based off this, the directors could redesign the SLA hours based on the priorities
- The high-level management can also understand if there is any agent who is continuously slacking on solving the incidents within SLA – Performance analysis
- Study the incident distribution raised by the IT Users and understand the efficiency of the Agents team
- The manager of the team could alter the assignment rules of the tickets to Agents based on this study
- Also, plan with the existing manpower to close the tickets based on the tickets open more than a week
- Ability to identify and prioritize the change requests based on the volume in each type and, figure currently in which stage, most of change requests stagnate
- The application owners can reach out to the Admin if more tickets are being stagnated at one stage
KPIs Architecture
Objectives |
KPIs |
Measures |
Data Source |
1, Analyze how well the SLAs are handled and have a weekly check on how many SLA breaches happen |
Active SLAs at Risk |
count(Task) with Active = true & Active_business_elapsed is between 60% and 200% |
Fact_Task_SLA |
Active SLAs at Risk as % Total Active SLAs |
[Active SLAs at Risk] / (count(Task) with Active = true) |
Fact_Task_SLA |
|
Active SLAs Breached |
count(Task) with Active = true & Active_business_elapsed > 200% |
Fact_Task_SLA
|
|
Active SLAs Breached as % Total Active SLAs |
[Active SLAs Breached] / (count(Task) with Active = true) |
Fact_Task_SLA
|
|
Active SLAs |
count(Task) with Active = true |
Fact_Task_SLA
|
|
Active SLAs as % of total SLAs |
[Active SLAs] / count(Task) |
Fact_Task_SLA
|
|
SLAs |
count(Task) |
Fact_Task_SLA
|
|
2, Study the incident distribution raised by the IT Users and understand the efficiency of the Agents team
|
Critical Incidents – Currently Open |
count(sys_id) with Priority = Critical and Incident State = In Progress or New |
Fact_Incident Dim_Incident_State Dim_Priority |
Critical Tickets open for more than a week |
count(sys_id) with Priority = Critical and Incident State = In Progress or New and Timeframe in weeks is last 2 weeks |
Fact_Incident Dim_Incident_State Dim_Priority Dim_Date |
|
Currently Open Incidents |
count(sys_id) with Incident State = In Progress or New |
Fact_Incident Dim_Incident_State |
|
Currently Unassigned Incidents |
count(sys_id) with Incident State = New |
Fact_Incident Dim_Incident_State |
|
% of Critical and High priority incidents unassigned |
( count(sys_id) with Priority = Critical and High and Incident State = New ) / [Currently Unassigned Incidents] |
Fact_Incident Dim_Incident_State Dim_Priority Dim_System_Users |
|
This Week Closed Incidents |
count(sys_id) with Incident State = Closed and Timeframe in Weeks in This week |
Fact_Incident |
|
(This week’s closed tickets) Change % from last week |
[This Week Closed Incidents] / ( count(sys_id) with Incident State = Closed and Timeframe in Weeks in This week ) |
Fact_Incident Dim_Incident_State Dim_Date |
|
3. Ability to identify and prioritize the change requests based on the volume in each type and, figure currently in which stage, most of change requests stagnate |
High Impact Change Requests |
count(sys_id) with Impact = High |
Fact_Change_Request Dim_Impact |
High Impact Change Requests Performed |
count(sys_id) with Impact = High and Request State = Closed |
Fact_Change_Request Dim_Impact Dim_Change_State |
|
Scheduled Change Requests |
count(sys_id) with Request State = Scheduled |
Fact_Change_Request Dim_Change_State |
|
Authorized but not Scheduled |
count(sys_id) with Request State = Authorized |
Fact_Change_Request Dim_Change_State |
|
Active Change Requests – This week |
count(sys_id) with Active = true and Timeframe in weeks = This week |
Fact_Change_Request Dim_Date |
|
Compared to last week |
[Active Change Requests – This week] / ( count(sys_id) with Active = true and Timeframe in weeks = This week ) |
Fact_Change_Request Dim_Date |
|
Active Change Requests that fall outside Maintenance Schedule |
count(sys_id) with Active = true and Outside Maintenance schedule = false |
Fact_Change_Request |
|
Active Change Requests that require CAB approvals |
count(sys_id) with Active = true and CAB approval = true |
Fact_Change_Request |
Entities Relationship Diagram
Plugins & Scripts
- Plugin : BloX (V2.1.2)
- Plugin : Custom Bar Column Chart
- Plugin : Style Widget Title
- Others: In the admin settings, the start of the week is set to be Monday
There is an image used that is available in the “Source Files” folder which needs to be pasted in the following location “Sisense\app\plugins\BloX\blox-images\IndicatorCenter” and the name of the image is “ServiceNow.png”