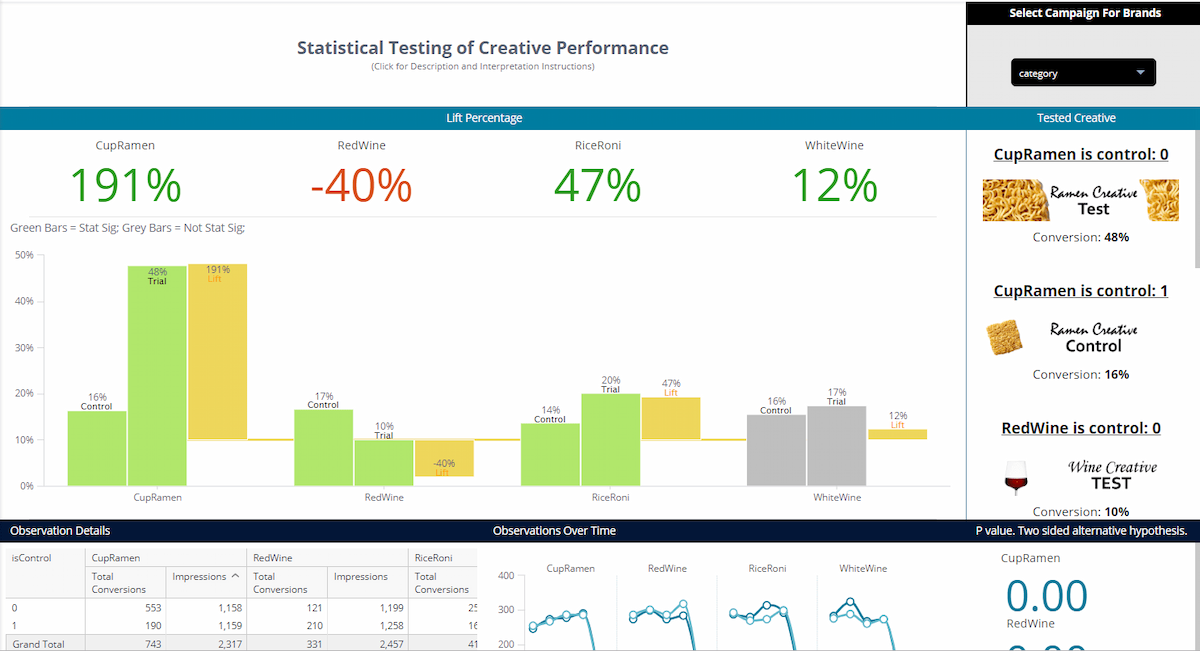
High Level Design
Overview
This dashboard assists marketers in determining if an alternative creative's good or bad performance, in terms of lift, is attributable to chance by performing a Pearson Chi-Squared Test on two competing creatives. It does not perform a power test for establishing the minimum sample-size requirement and consider type II error. R integration powers a prop.test() function that generates the p-value.Goals
Compare the performance of two competing creatives and determine if differences in results can be attributed to chance.
Objectives
- Determine if a brand’s conversion performance is attributed to chance
KPI Architecture
Objectives | KPIs | Measures | Data Source |
Track if statistical significance has been reached | P Value | P value < 0.05 for single tail t test,
P value < 0.025 for two tail t test rdouble(FALSE, “ parr <- c(); for ( i in seq_along(args[[1]]) ){ pval <- prop.test(c(args[[1]][i], args[[2]][i]),c(args[[3]][i], args[[4]][i]))$p.value; parr <- append(parr, pval,after = length(parr)); }; parr”, [Control Conversions], [Test Conversions], [Control Observations], [Test Observations]) |
Primary fact table |
Performance Comparison | Average Per Control/Test | Impressions / Conversions | |
Lift % | ( [X2 Test] / [X1 Control] ) – 1 |
Entities Relationship Diagram
Plugins & Scripts
1. BloX
2. Trellis Plugin