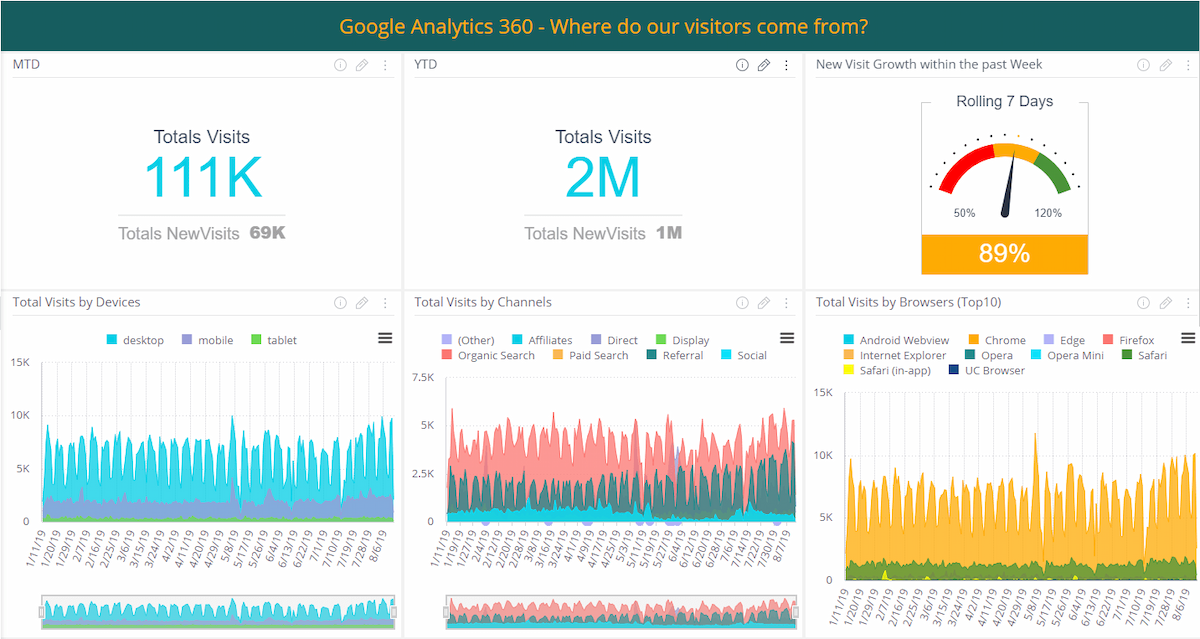
High Level Design
Overview
Google Analytics 360 is Google’s flagship for digital reporting and analytics. It has reporting and tracking abilities and it includes features, such as multi-channel funnel reports, enhanced ecommerce, and attribution modeling One of the greatest premium features of GA 360 is unsampled data. With the BigQuery integration feature, all your raw data can be automatically imported into Google BigQuery where you can then query it to your heart's delight.Among the areas that GA 360 covers are Traffic, Content, E-Commerce, Revenues, Sources, Geo, Google Ads and more.
(Attribution modeling uses machine learning to assign weights to each touchpoint of a user’s journey. It spans different devices and channels, combining data from Google Analytics, AdWords, and Doubleclick to comprehensively determine Digital Attribution.)
● The sample data set is of Google’s Ecommerce shop ● BigQuery Export schema
Goals
Improve ROI from data analytics, increase traffic from new users, optimize accessibility for clients, focus on core countries and recognize developing markets.
Objectives
- Monitoring total visitors and new visitors
- Understanding traffic to the website by Geo, Devices, Channel and Browsers
- Understanding visitors trends and patterns
KPIs Architecture
Objectives |
KPIs |
Measures |
Data Source |
Total visitors & new visitors |
MTD – # Total Visits Total visits MTD (Indicator) |
(sum([Totals.visits]) , [Months in Date]=this month ) |
ga_sessions |
MTD – # Total New Visits Total new visits MTD (Indicator) |
( sum([Totals.new Visits]) , [Months in Date]=this month ) |
||
YTD – # Total Visits Total visits YTD (Indicator) |
(sum([Totals.visits]) , [Year in Date]=this month ) |
||
YTD – # Total New Visits Total new visits YTD (Indicator) |
( sum([Totals.new Visits]) , [Years in Date]=this month ) |
||
New Visits This Week vs. Last Week (Area Chart) |
This Week: (sum([Totals.visits]) Last Week: ([Total totals.newVisits] , prev([Days in VisitDateAdjusted] , 14)) X-Axis: DayOfWeekNumber ((filter dates for last 7 days) and format date as EEEE) |
||
Rolling 7 Days New Visits Growth (Gauge) |
rpsum([Total totals.newVisits],7) / (rpsum([Total totals.newVisits],14) – rpsum([Total totals.newVisits],7)) |
||
Traffic to the website by Geo, Devices, Channel, Browsers
|
Devices (Area Chart) |
(sum([Totals.visits]) X-Axis: Days in Date Break by: DeviceCategory |
|
Channels (Area Chart) |
(sum([Totals.visits]) X-Axis: Days in Date Break by: channelGrouping |
||
Browsers (Top10) (Area Chart) |
(sum([Totals.visits]) X-Axis: Days in Date Break by: Device Browser |
||
Total Visits by City (Scatter Map) |
(sum([Totals.visits]) Location: City |
Plugins
Scripts
- Disable Mouse Scroll Zoom On Scatter Map – When mouse scrolling on a Sisense dashboard that has many widgets – a Scatter Map can inadvertently be affected. This script will help keep the map in place. (link)
widget.on(“beforeviewloaded”, function (widget, args){
var map = args.options.map;
map.scrollWheelZoom.disable();
});