Schedule now
What is a BI dashboard?
Intro to data visualization
Best practices for building dashboards
How to create a better dashboard
Industry dashboards
More dashboards by industry
Customer Service
Marketing
Finance
Manufacturing
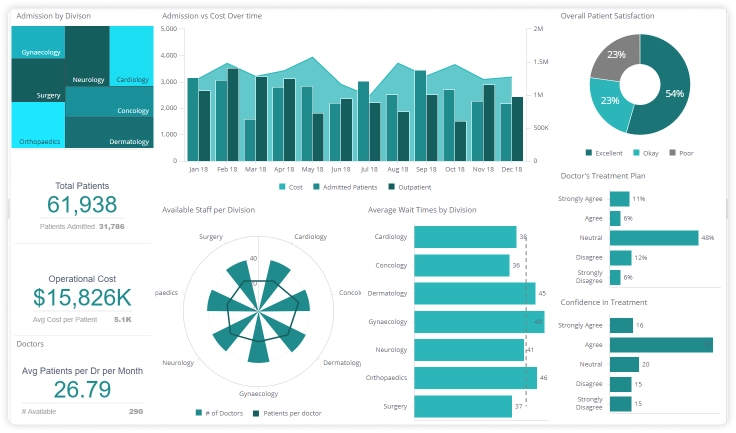
Healthcare
Human Resources
Load more
Book a live demo
Schedule now