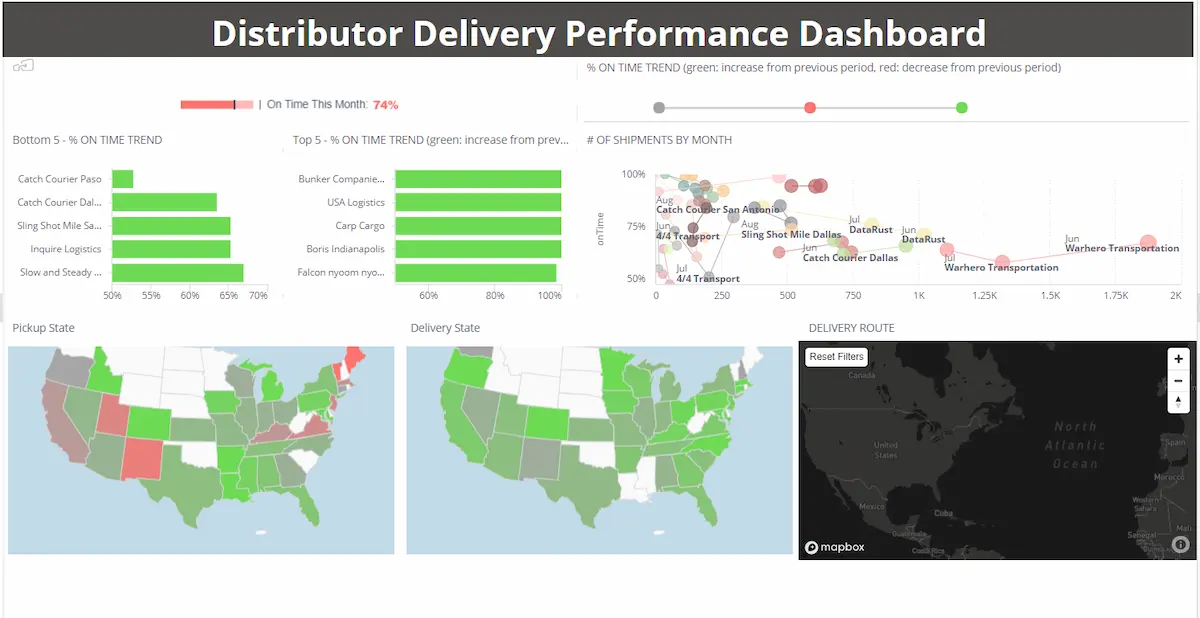
High Level Design
Overview
A distribution dashboard Provides high-level transparency of distributor routes, the number of shipments, and timeliness of shipments.Goal
Identify which distributors are positively or negatively affecting the overall on-time delivery rate. Identify what the relationship between the number of shipments and on-time delivery for distributors. Optimize distributor selection by avoiding one distributor carrying excessive volume.
Objectives
- Identify which distributors can handle more volume
- Identify and reduce dependency under-performing distributors
- Identify distributors by distribution path
KPIs Architecture
Objectives | KPIs | Measures | Data Source |
Identify which distributors can handle more volume | Distributor On-Time Delivery / Volume ratio | AVG on-time delivery | Distributor, Time Resolution, Pickup-State |
Total delivery | Distributor, Time Resolution, Pickup-State | ||
Reduce dependency on under-performing distributors | Bottom ten on-time delivery by distributors | Distributor filtered to bottom ten by on-time delivery | Distributor |
Identify distributors by distribution path | On-time delivery | On-time deliveries – late deliveries; if negative format as red. | Pick-up State, Delivery State |
Entities Relationship Diagram
Plugins & Scripts used
- Remove horizontal borders
- Connect points of scatter chart in chronological order
- Change line type in the drilled dashboard
- Route Map Plugin