Schedule now
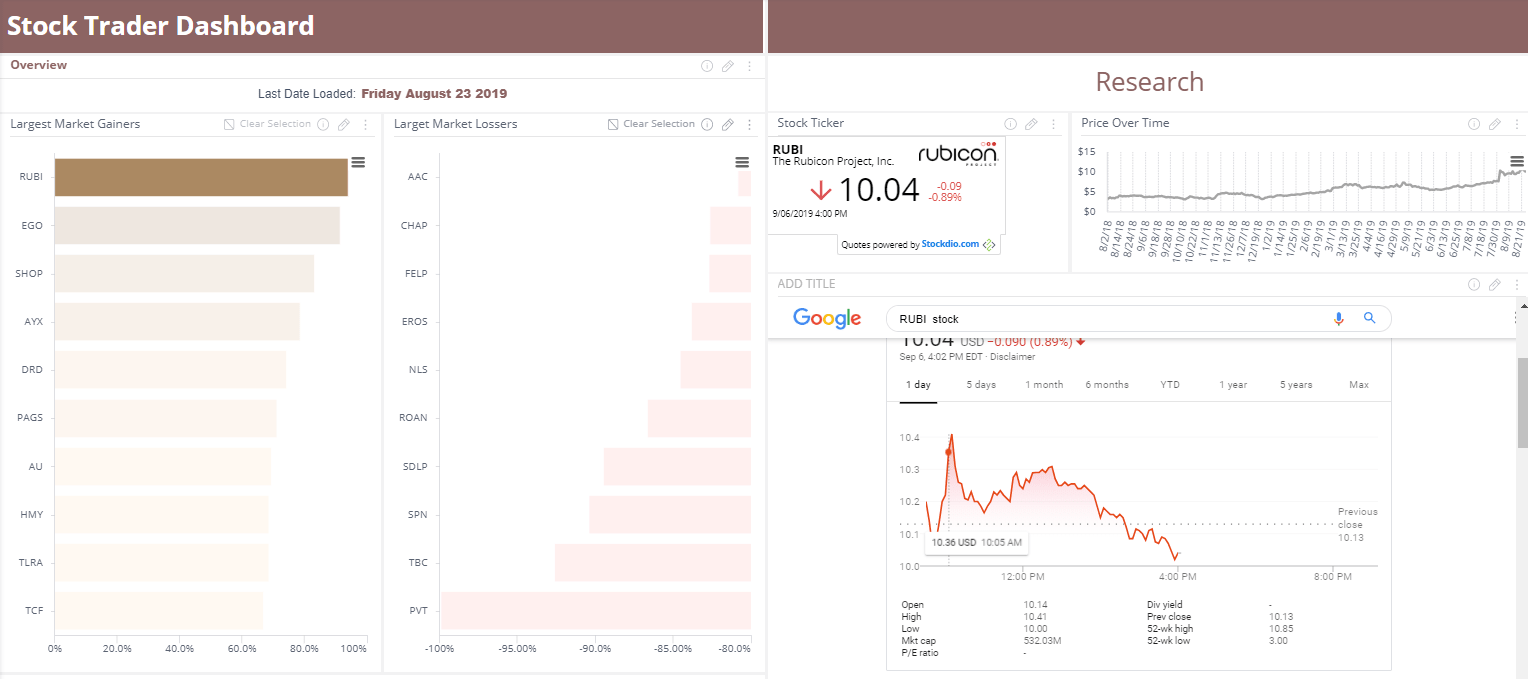
Stock Trader Dashboard
Explore this dashboard
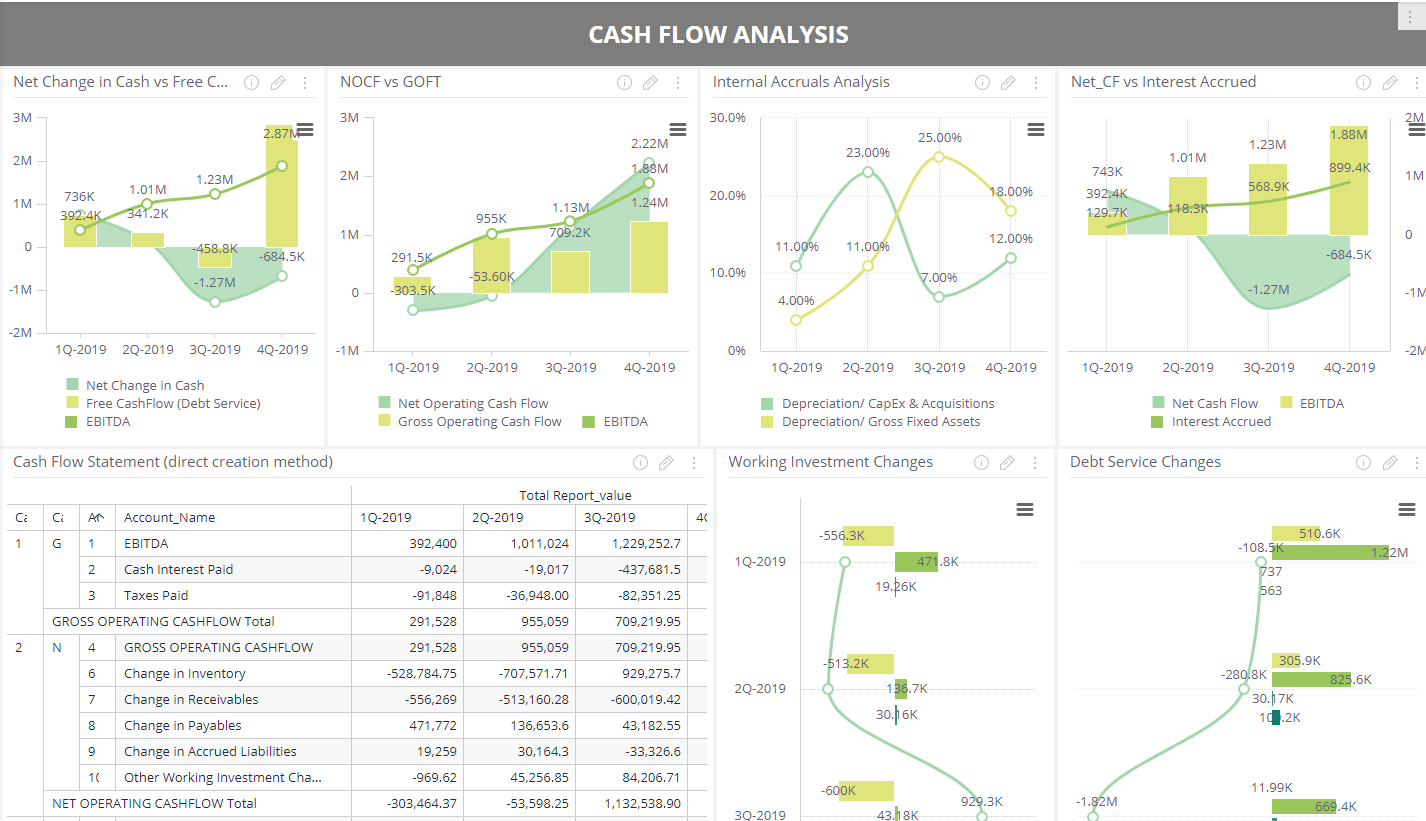
Cash Flow Statement Dashboard
Explore this dashboard
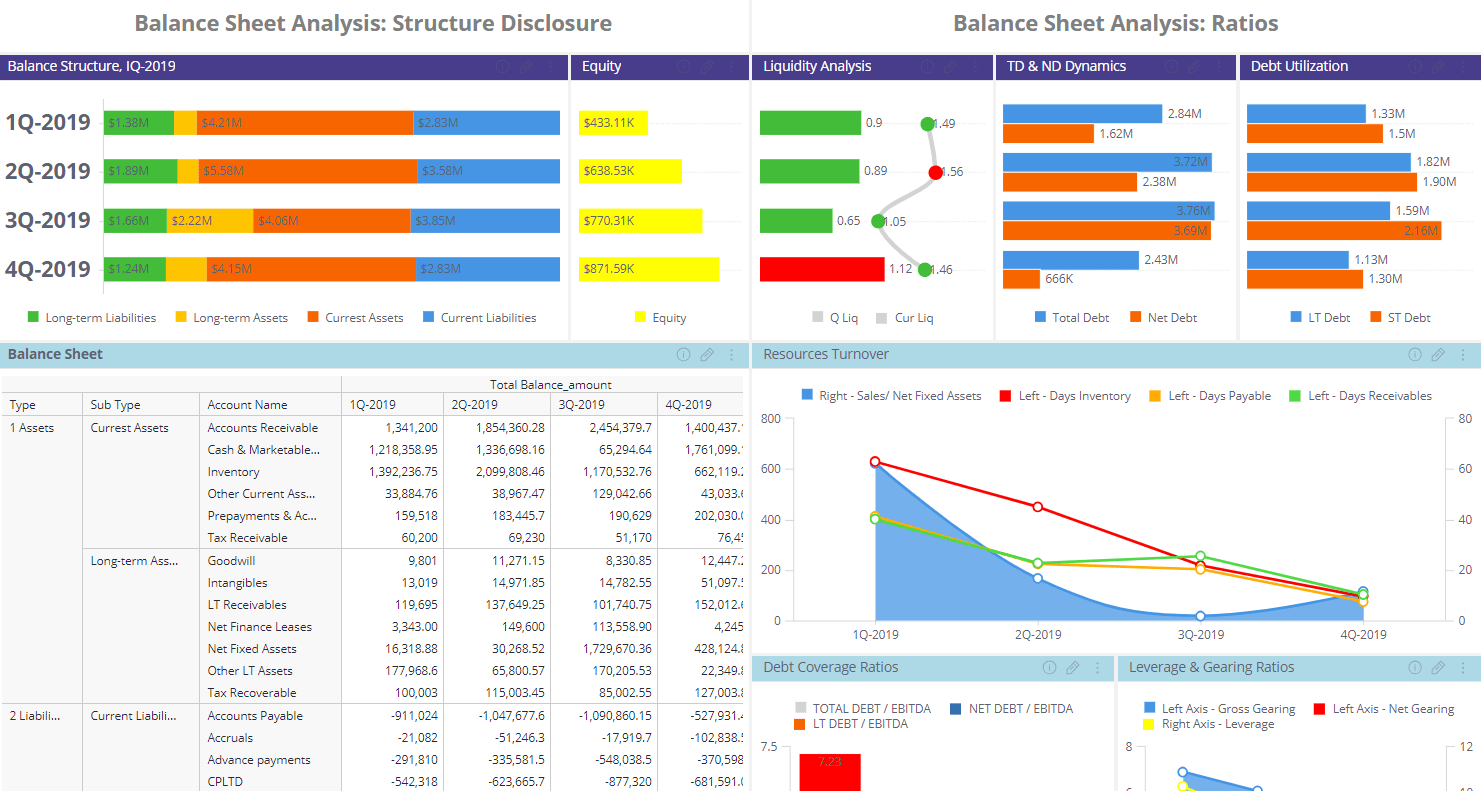
Balance Sheet Analysis
Explore this dashboard
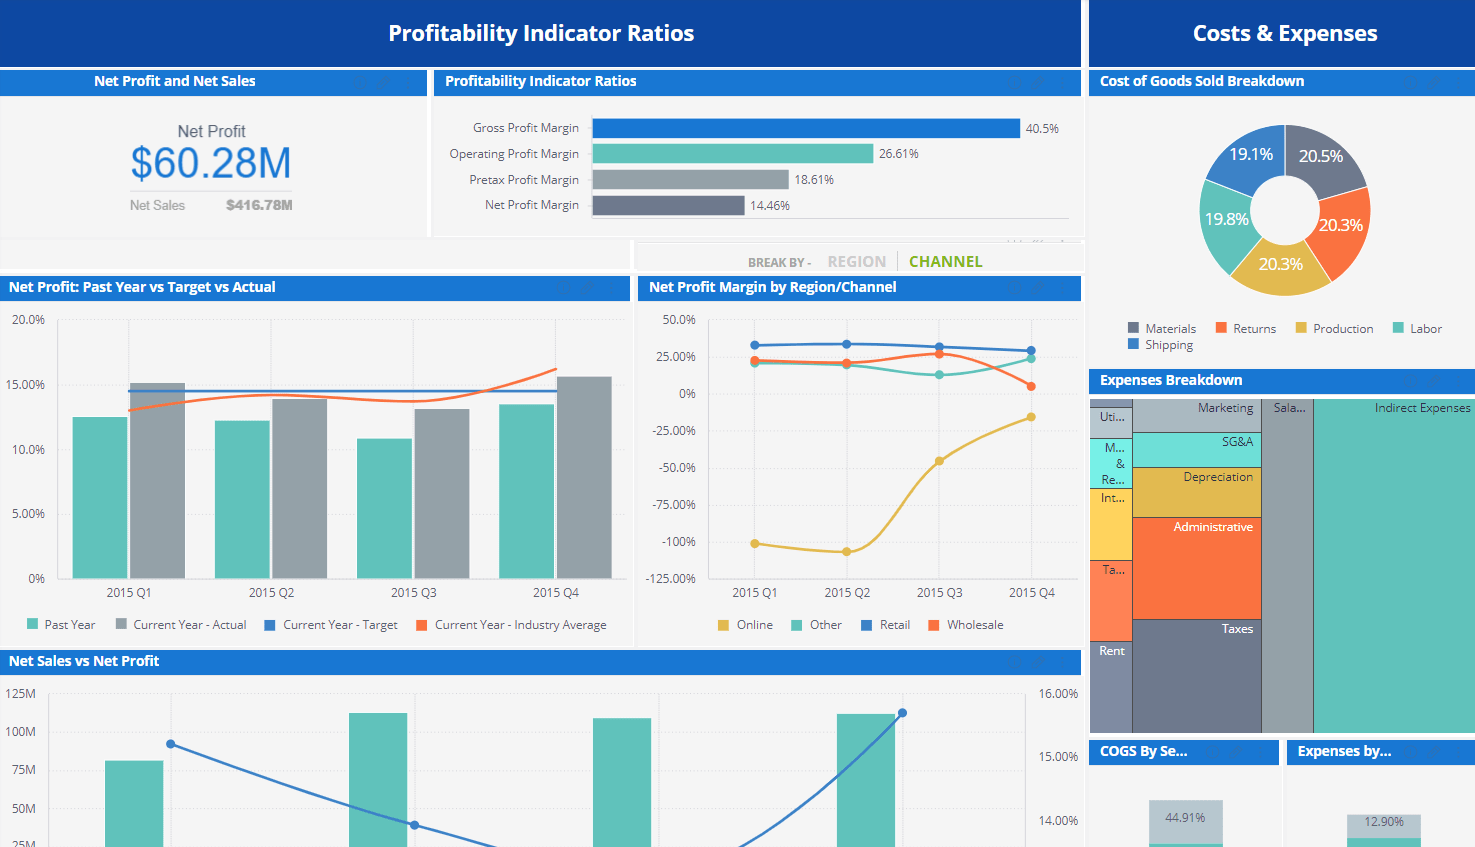
Profit Margin Analysis (CFO Dashboard)
Explore this dashboard
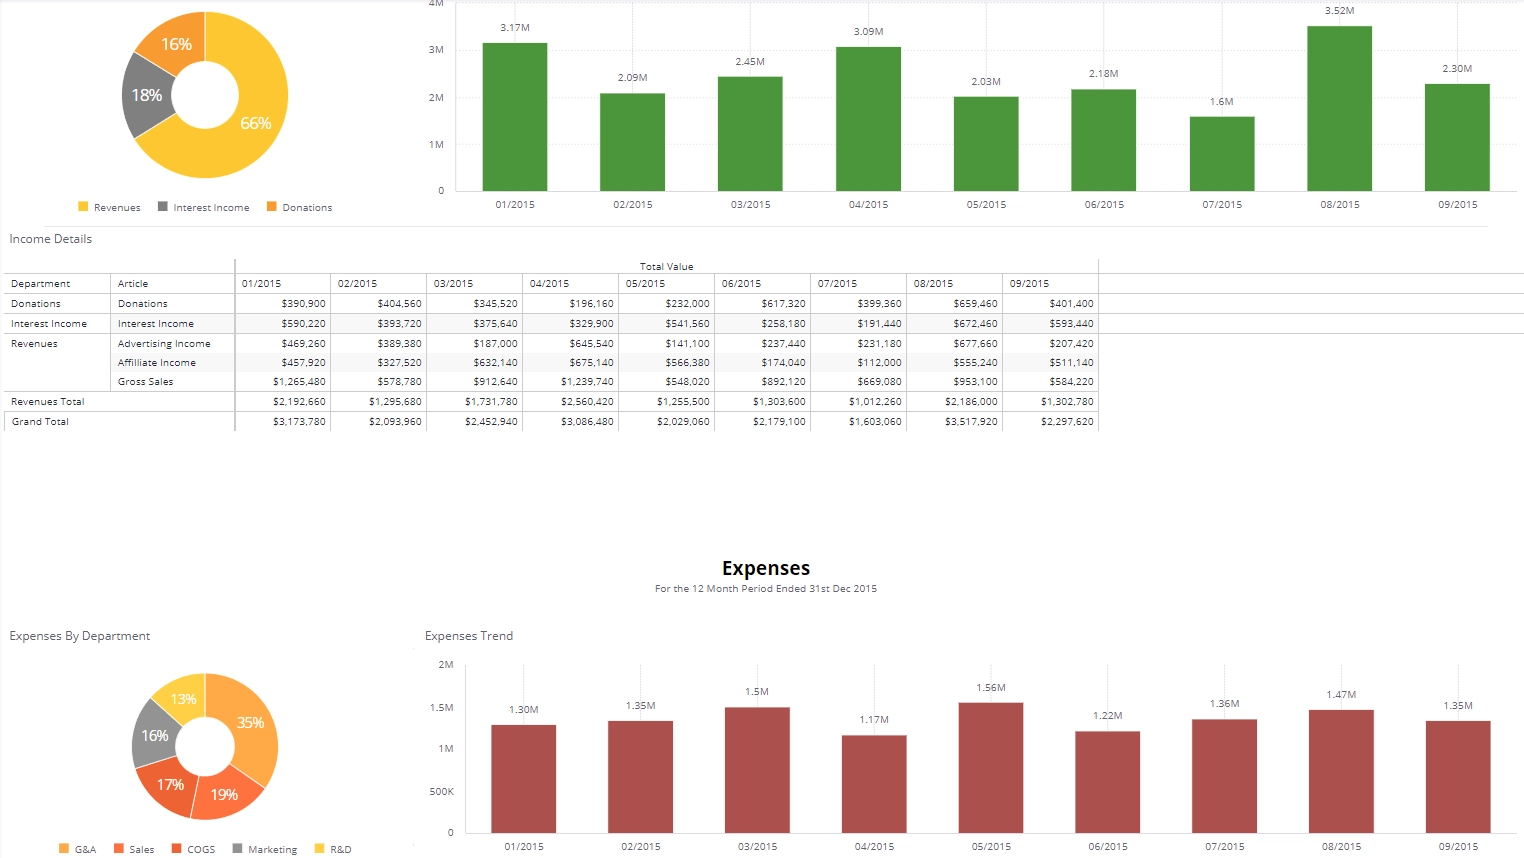
Profit and Loss Dashboard
Explore this dashboard
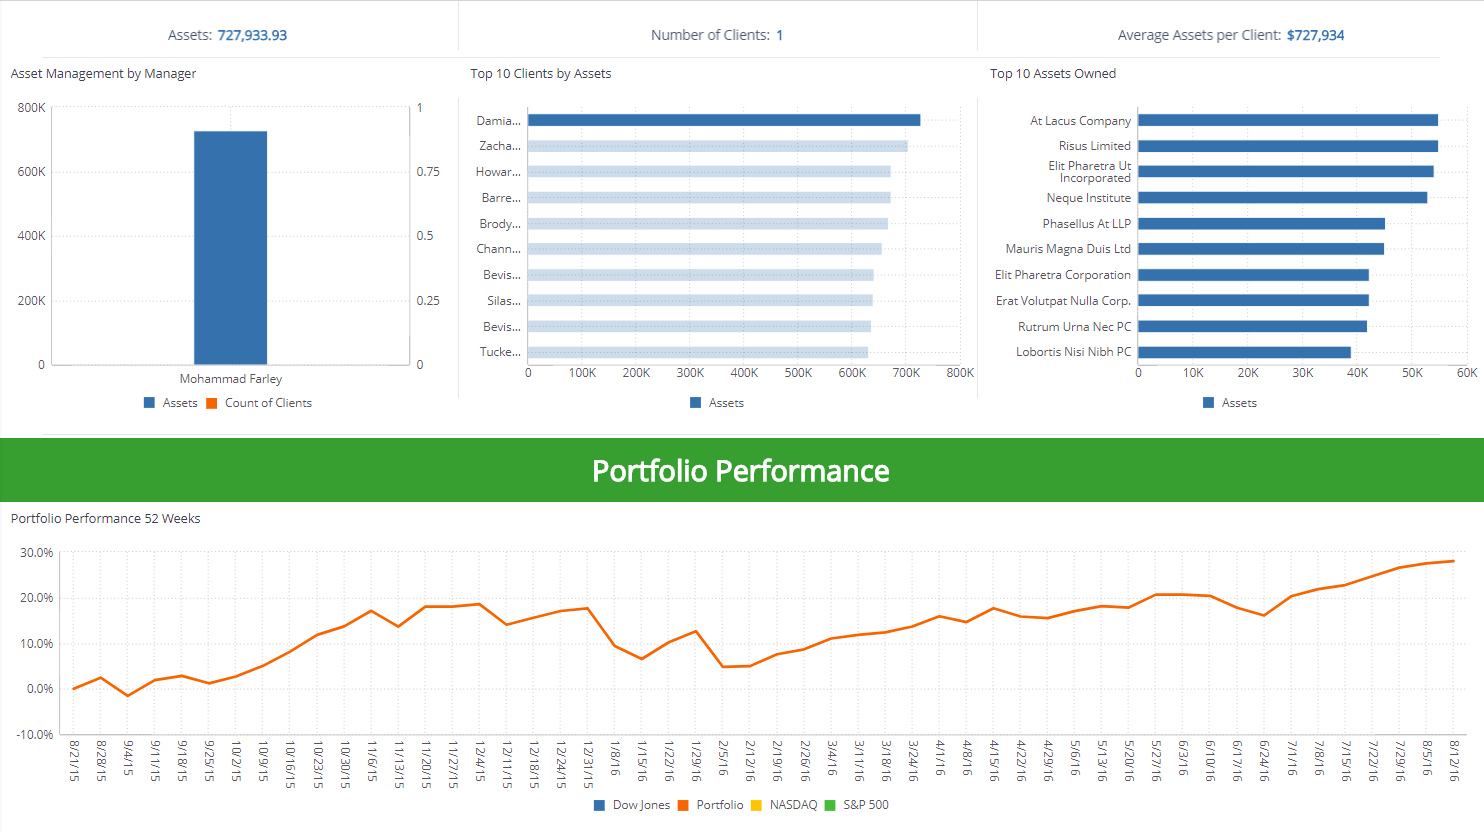
Investment Portfolio
Explore this dashboard