Book a live demo
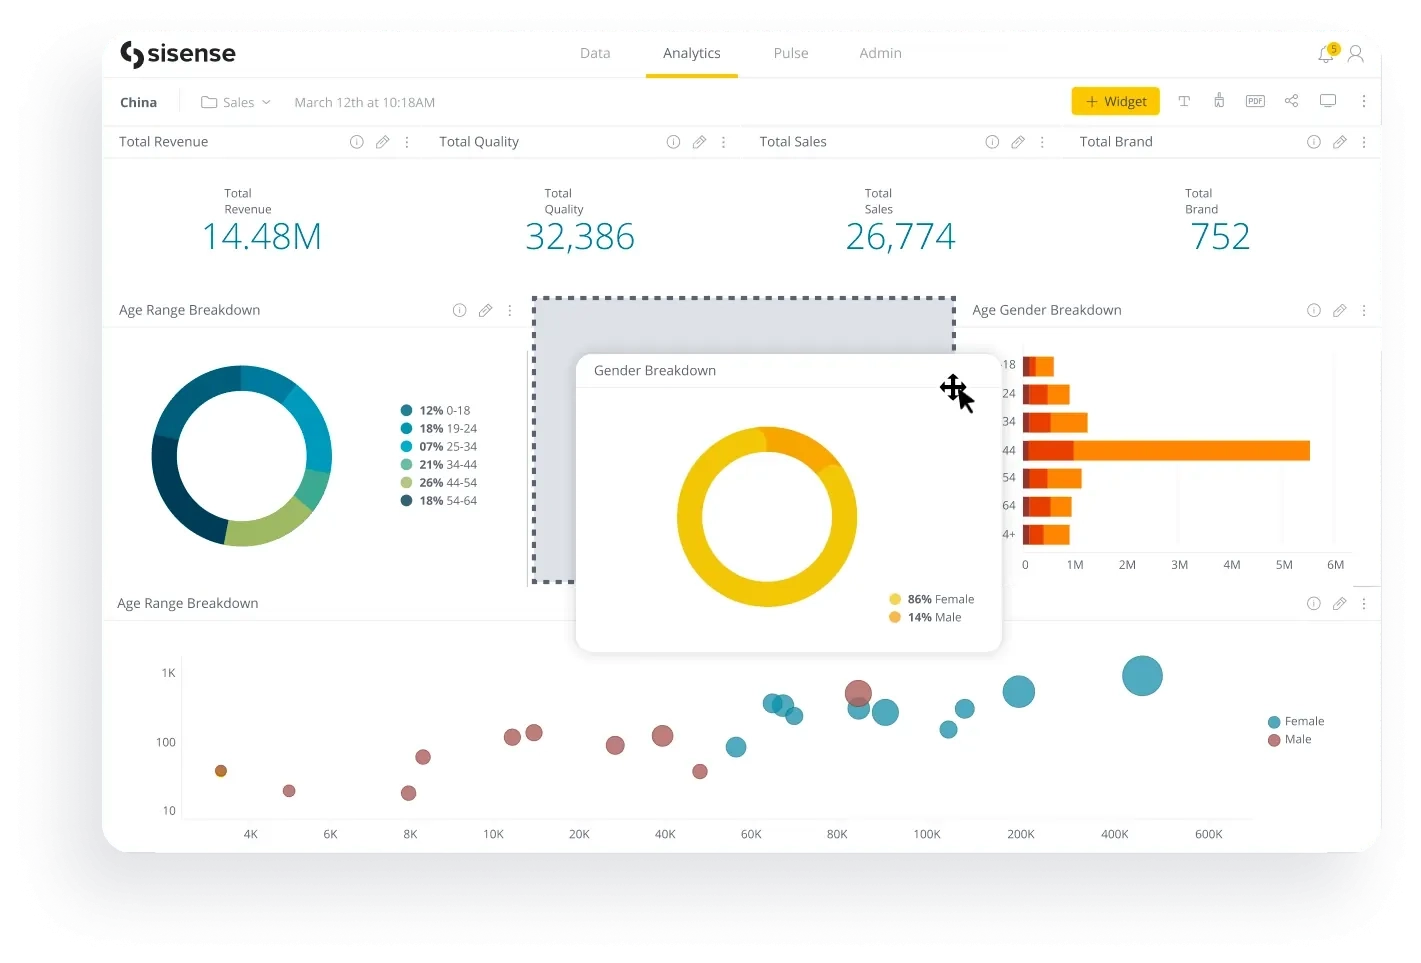
Custom dashboards
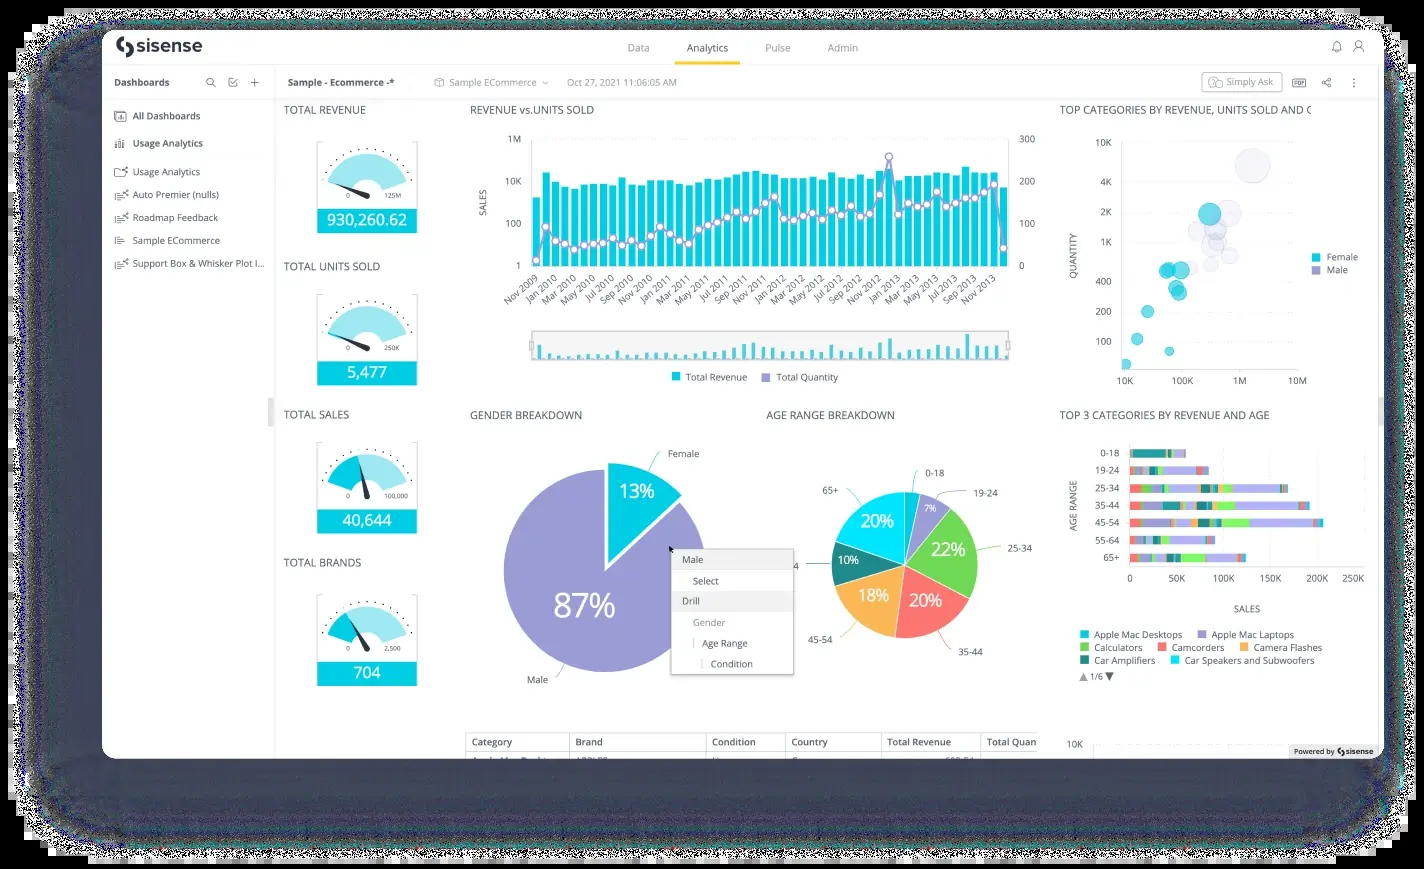
Interactive visualizations
Blox
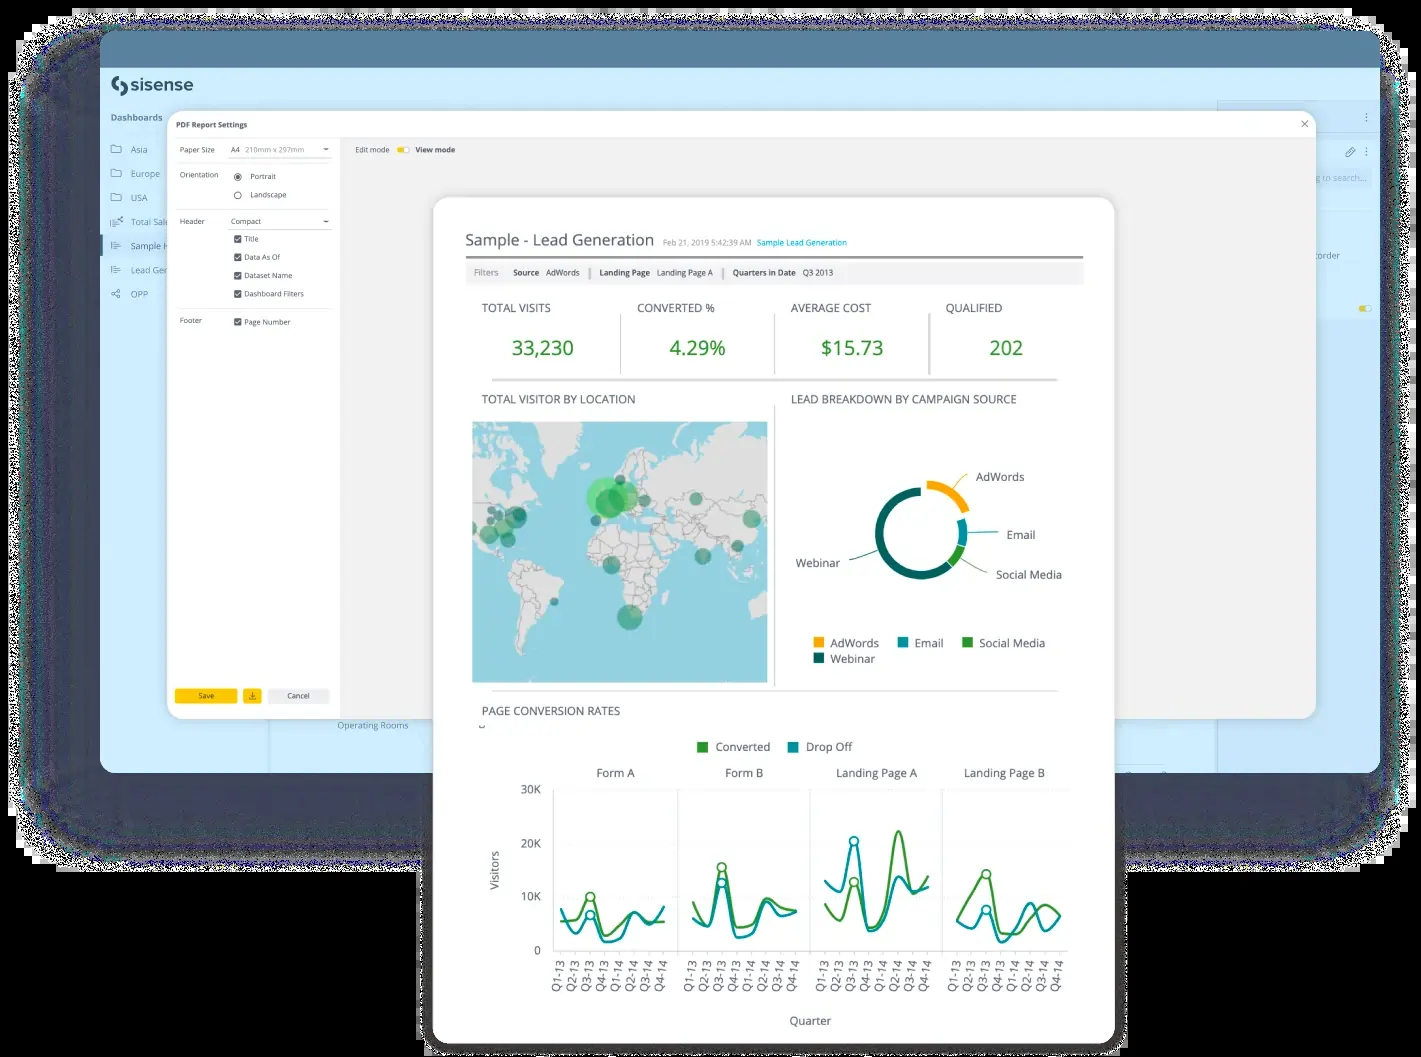
Reports
Custom dashboards
Explore dashboards
Interactive visualizations
Learn more about visualizations
Blox
Learn more about Blox
Reports
Learn more about reporting
Book a live demo
Schedule now