Schedule now
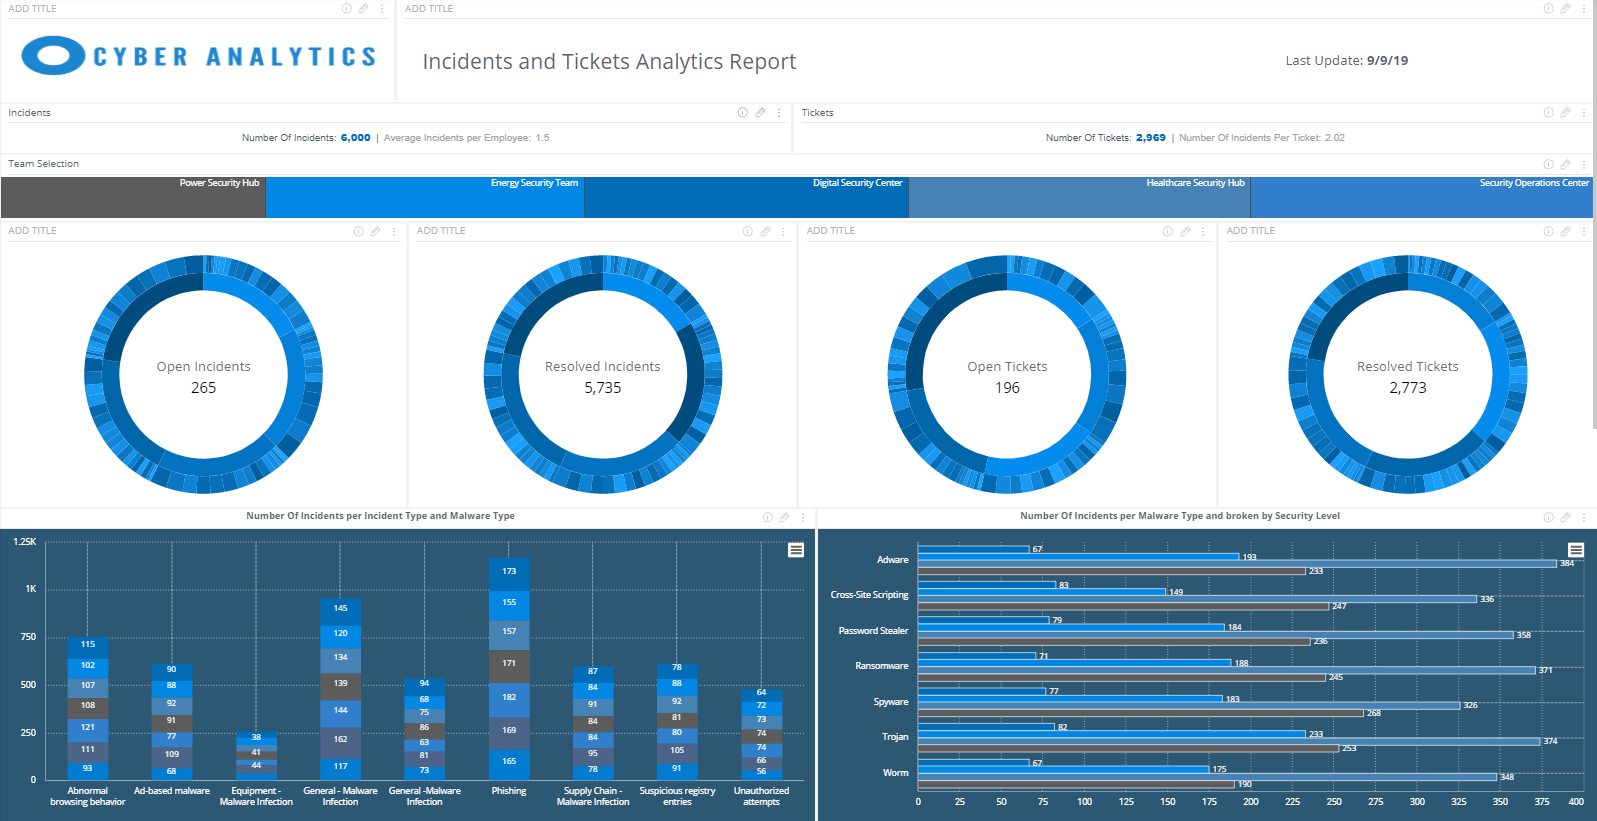
Cyber Analytics
Explore this dashboard
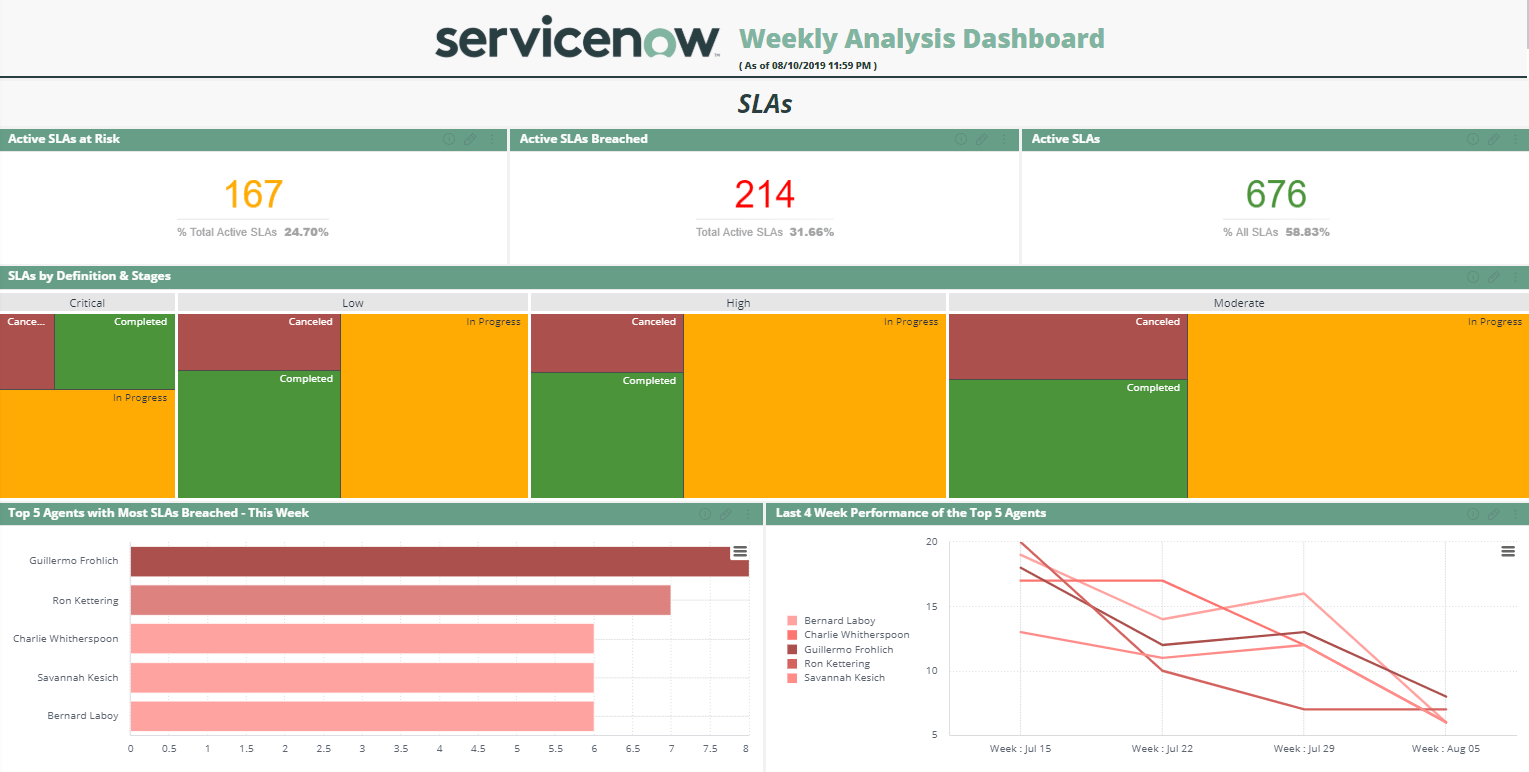
ServiceNow Weekly Analysis
Explore this dashboard
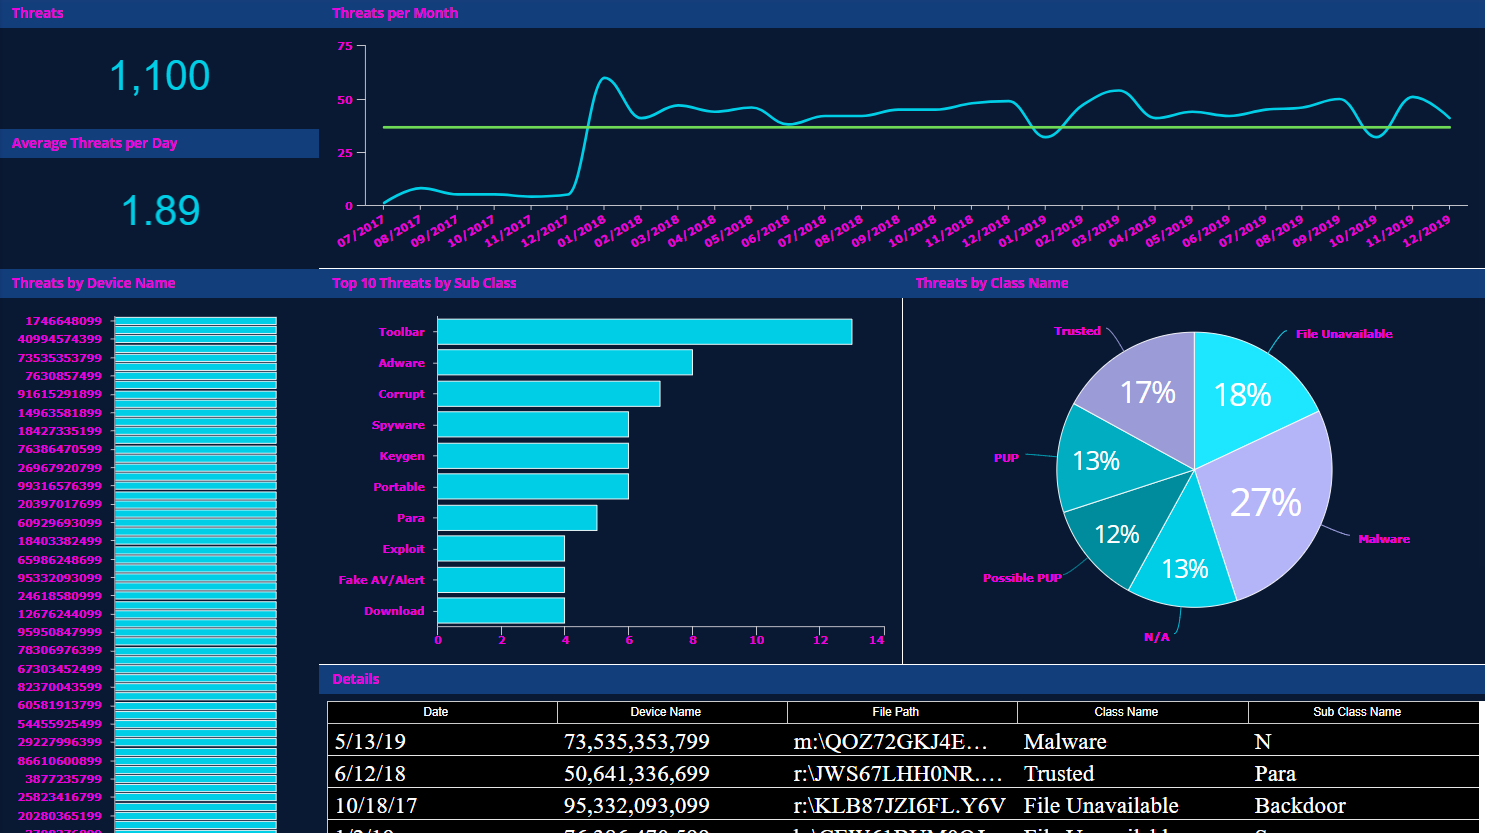
Cyber Security
Explore this dashboard