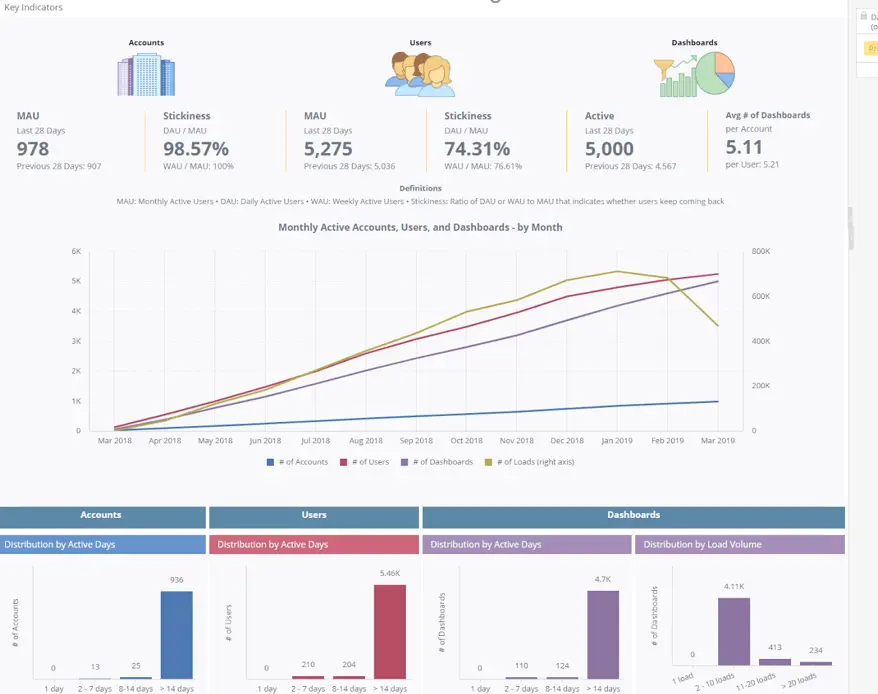
High Level Design
Overview
One of the key indicators of the value of a product is its engagement rate. This indicator measures how frequent and consistent the product is used by its target users and whether they keep coming back to use the product. In this Product Usage / User Engagement analytical dashboard, the product is a form of dashboard (or a software module, or a website page) and the users are the registered accounts (companies) and their individual users. By looking at this dashboard, engagement managers, customer success managers, and similar roles will be able to monitor the product-user engagement over time.Goals
The goal of this dashboard is to provide an understanding of whether users find values in the product (in this case, a dashboard) that is developed for them. The more value they find, the more likely they will come back and use the product again the next day, week, and month, which in turn also make it easy for the company to monetize its product. This dashboard is developed with the goal of giving meaningful insights for engagement managers, customer success manager, and similar roles about the overall quality of their product/content and the effectiveness of their engagement strategies by measuring daily, weekly, and monthly user engagement and stickiness, and ultimately help them to take appropriate actions to boost the engagement rate. These insights will also provide a forceful driver for the product developer team, R&D team, and customer service team to keep improving and delivering excellence in both product and service.
Objectives
- Understanding the daily, weekly, and monthly engagement rate (active accounts/users).
- Understanding the stickiness (whether users keep coming back).
- Determine the top products with highest engagement rate.
KPI Architecture
Objectives | KPIs | Measures | Data Source |
Understanding the daily, weekly, and monthly engagement rate (active accounts/users). | Accounts:
Users:
Dashboards:
|
|
Fact_User_Action |
Understanding the stickiness (whether users keep coming back). | Accounts:
Users:
|
|
Fact_User_Action |
Determine the top products with highest engagement rate. | Dashboards:
|
|
Fact Taxi Trips |
Entities Relationship Diagram
Blox