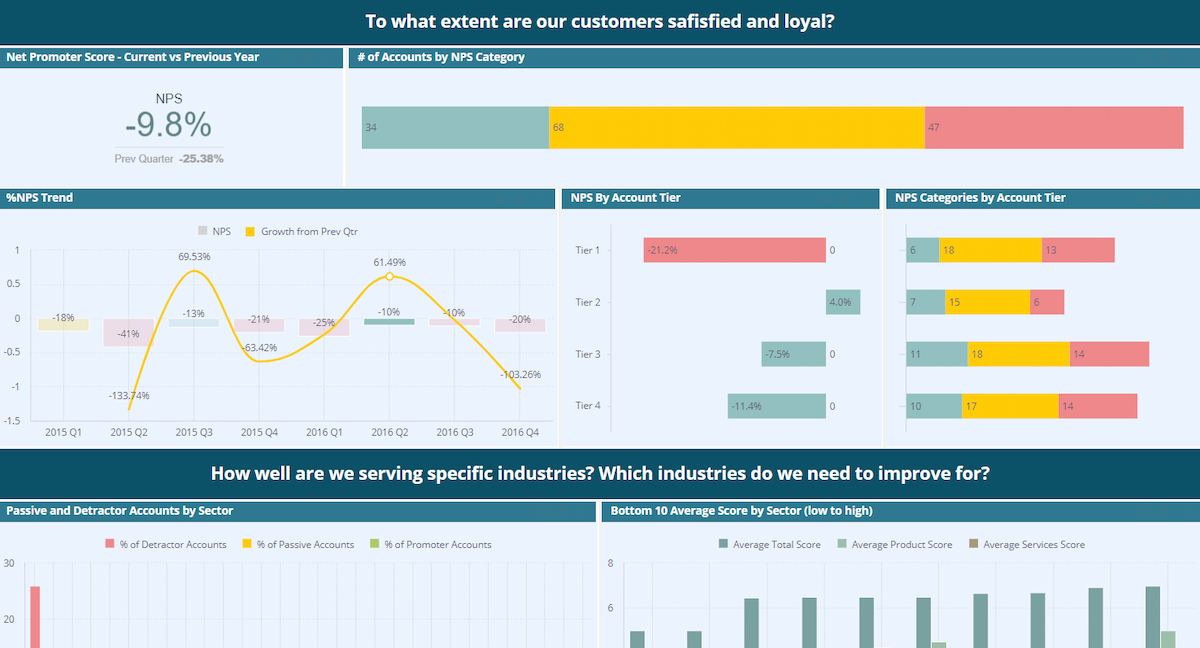
High Level Design
Overview
Understanding how satisfied – and consequently, how loyal your customers are likely to be – is important for any company, because happy and returning customers are the key to growing future revenue and profits. The problem is that most customers surveys are complex, expensive and hard to interpret. In response to this, the net promoter score was developed as ‘the one number you need to know’ based on just one simple questions: how likely are you to recommend the company/product/service to a friend or colleague? The NPS is based on the fundamental premise that every company’s customers can be divided into three groups: promoters, passives and detractors.Goals
Improve customer loyalty and enable profitable growth (research has shown that companies with better a NPS tend to grow more rapidly than competitors).
Objectives
Track the NPS groups (promoters / passives / detractors) and gain a clear measure of the company’s performance in its customers’ eyes
KPI Architecture
Objectives | KPIs | Measures | Break by | Data Source |
---|---|---|---|---|
Track the NPS groups (promoters / passives / detractors) and gain a clear measure of the company’s performance in its customers’ eyes | %NPS |
|
Month/QTR/Year Industry Account_Tier Account_Region Account Owner |
Survey Results Account Data |
Data Requirements
# | Source | Table Name | TableType |
---|---|---|---|
1 | Excel | Survey Results | Fact table |
2 | CRM | Account Data | Dimension table |