Schedule now
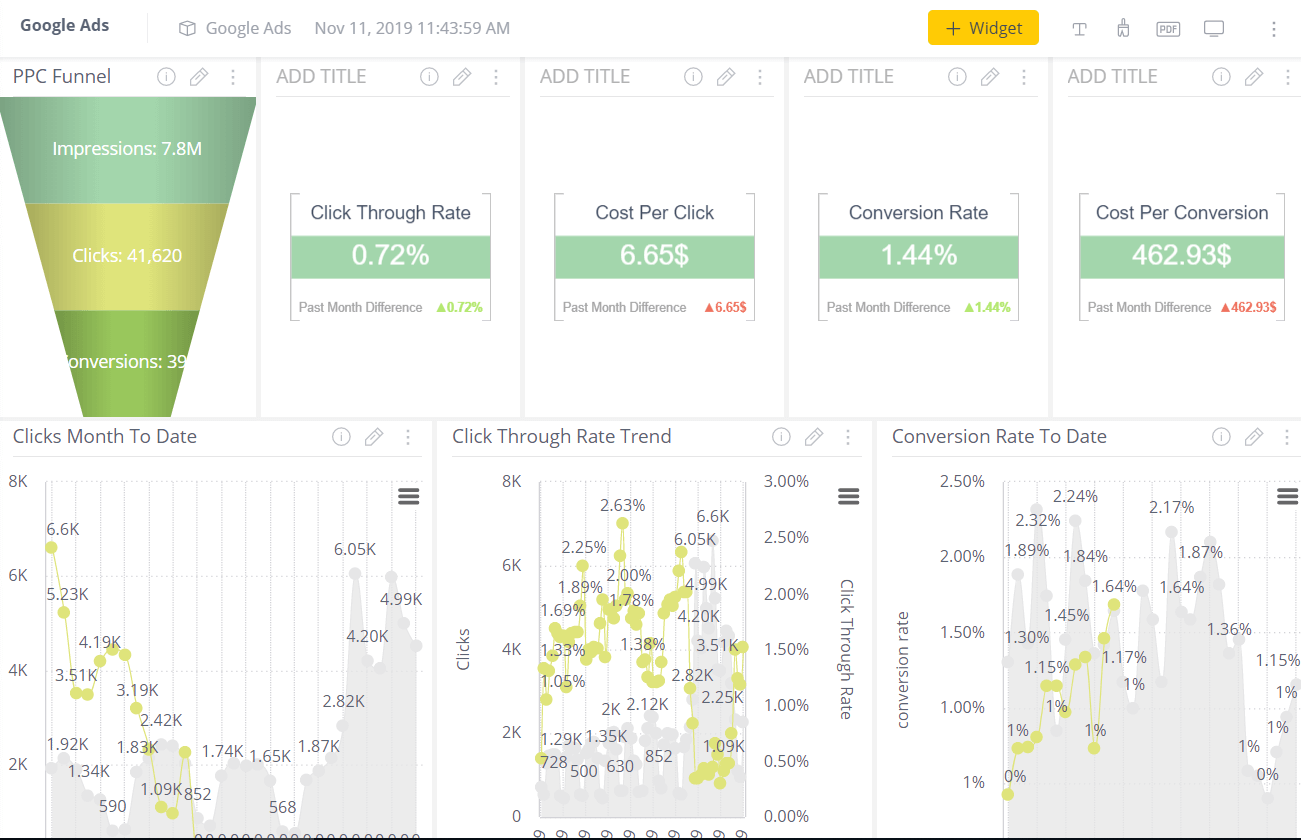
Google Adwords
Explore this dashboard
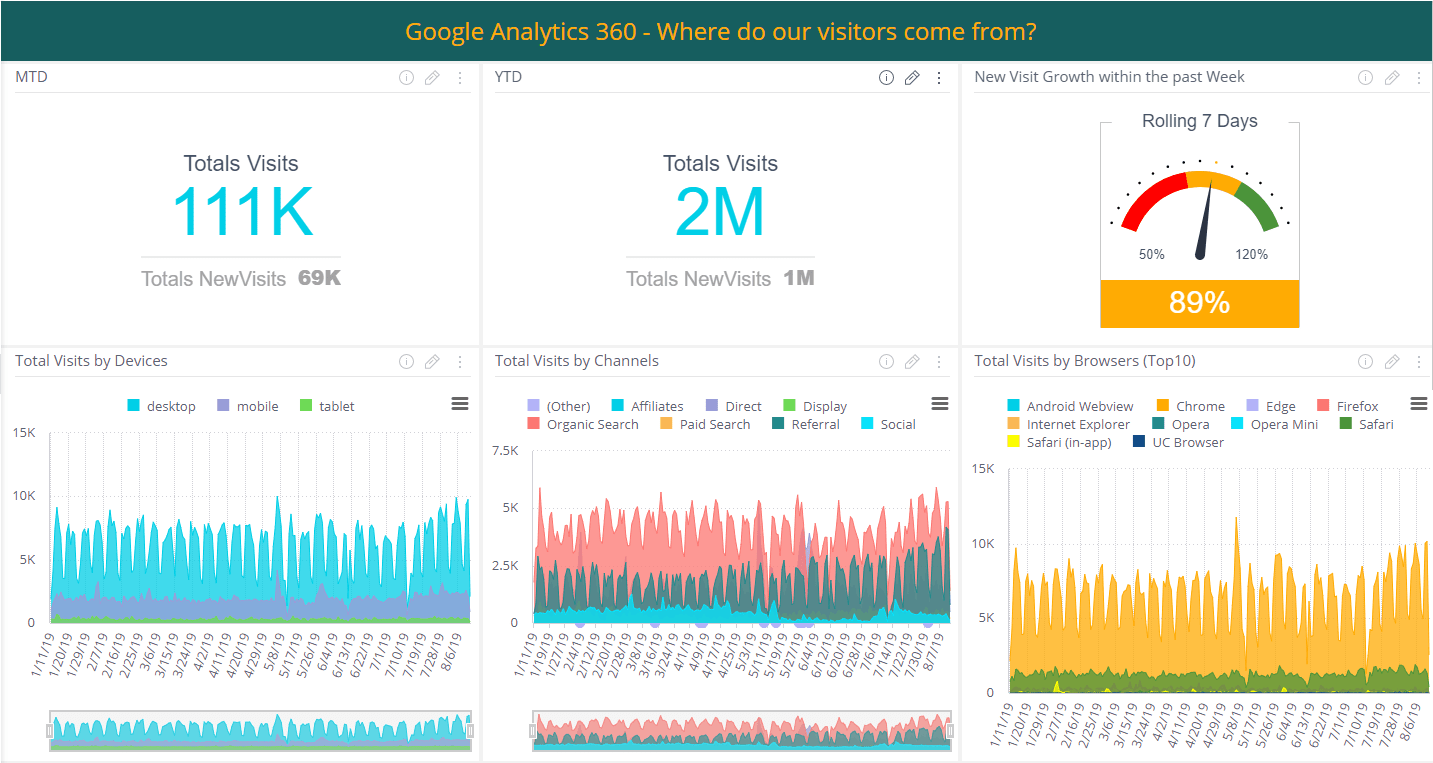
Google Analytics 360 – Visits
Explore this dashboard
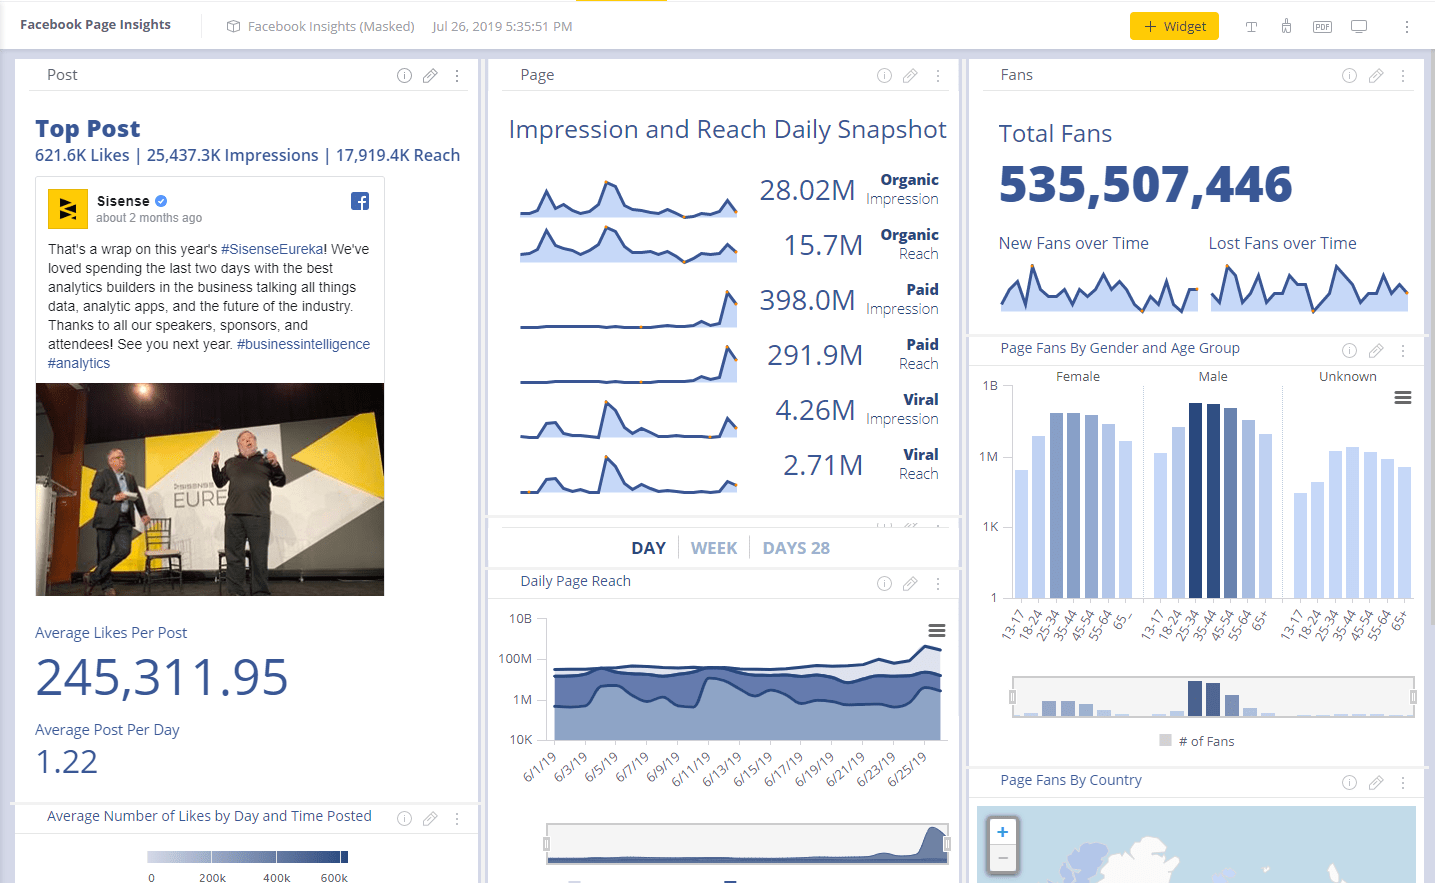
Facebook Insights
Explore this dashboard
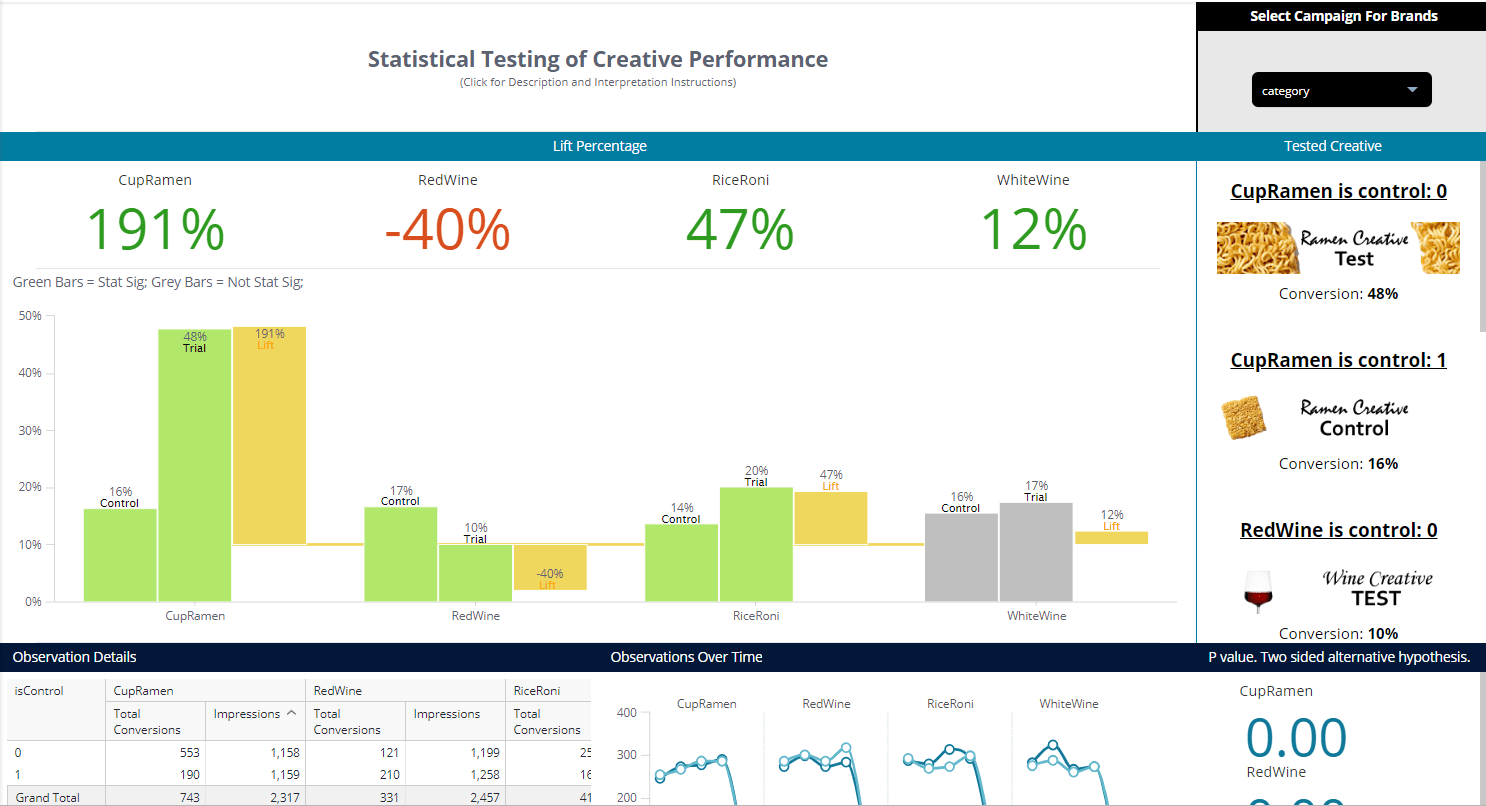
A/B Testing
Explore this dashboard
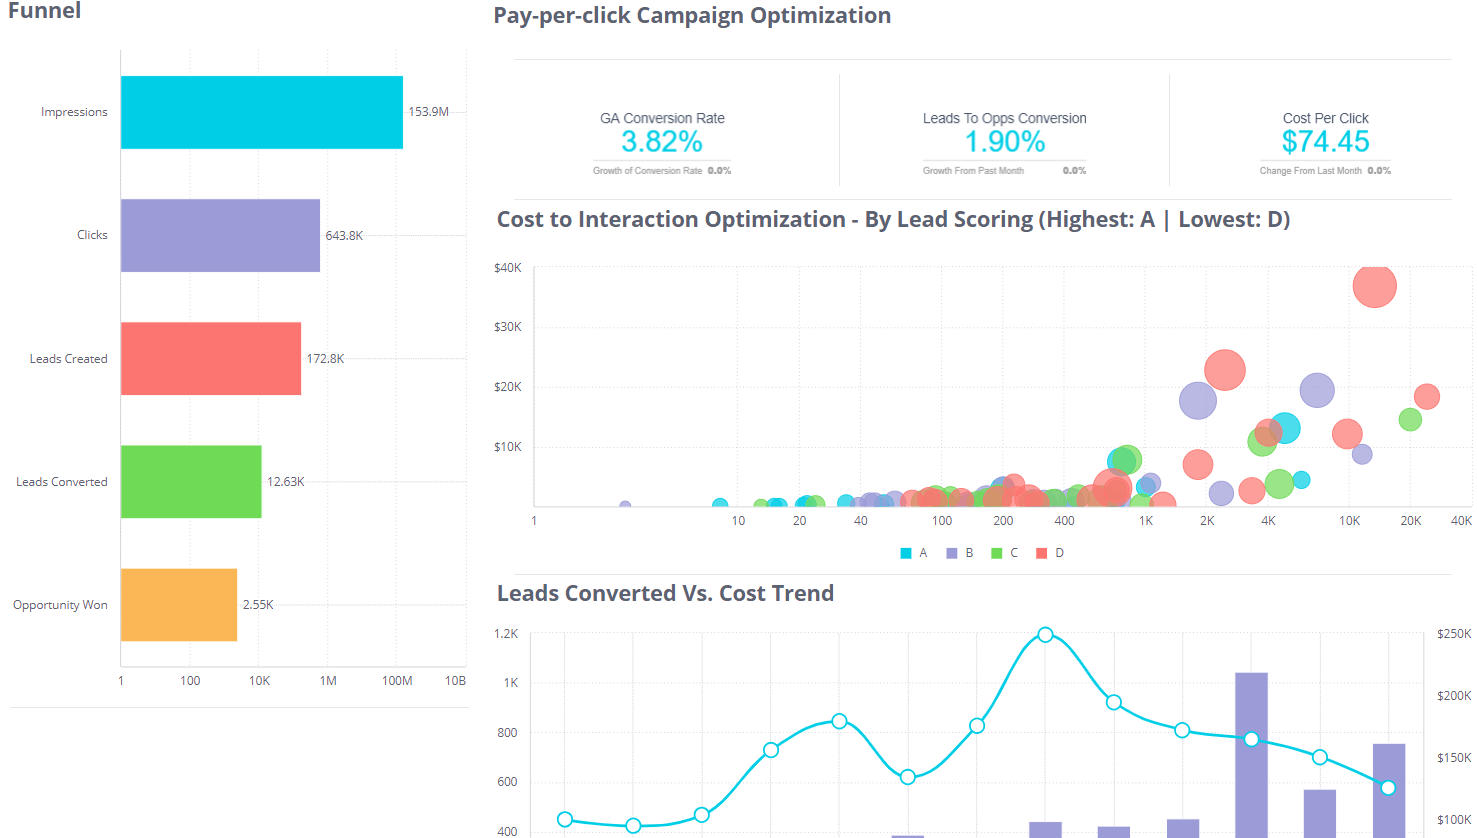
Search Engine Marketing (SEO and PPC)
Explore this dashboard
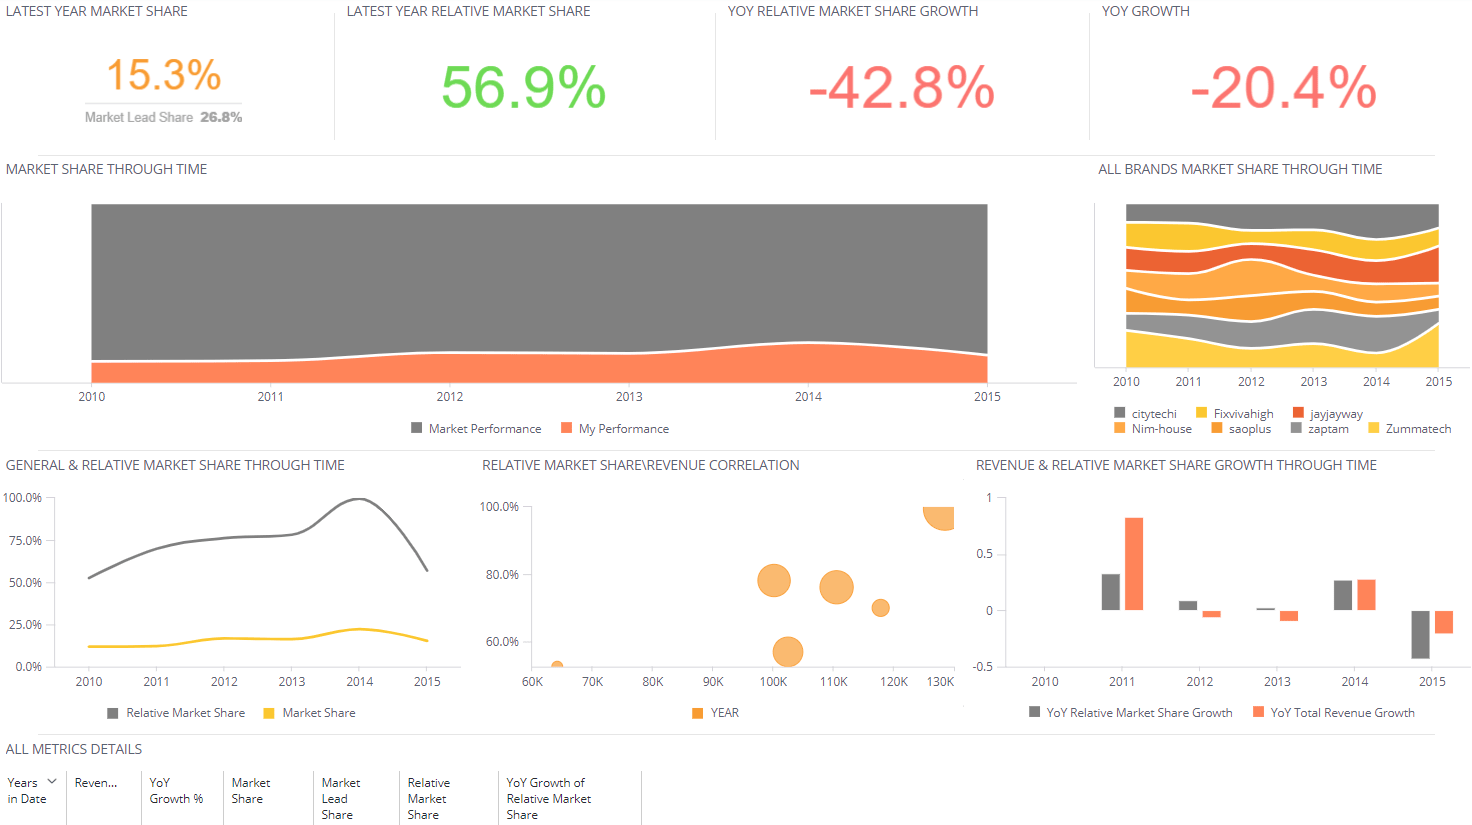
Relative Market Share
Explore this dashboard
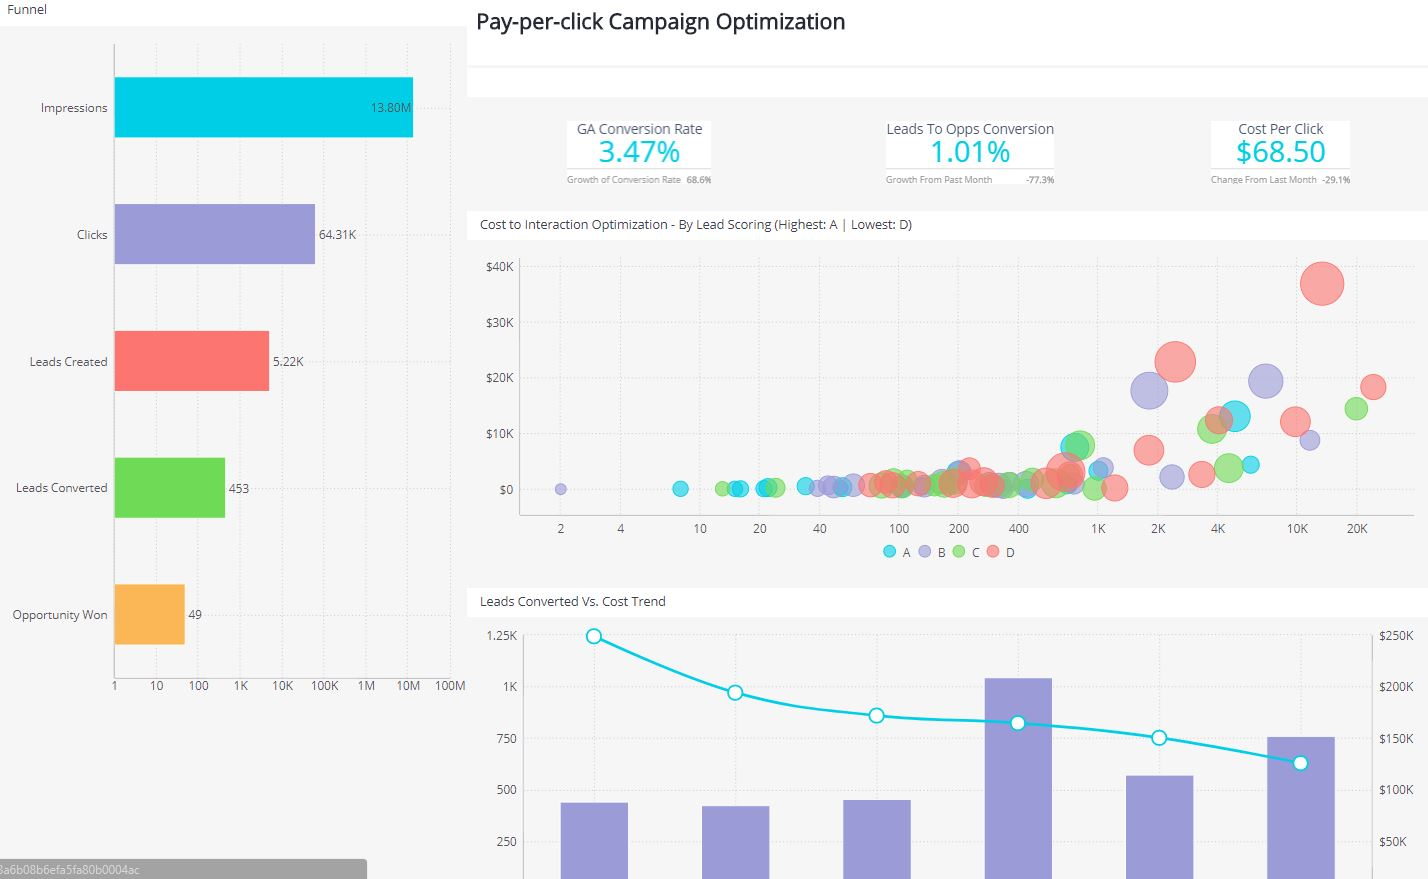
Marketing Campaign
Explore this dashboard
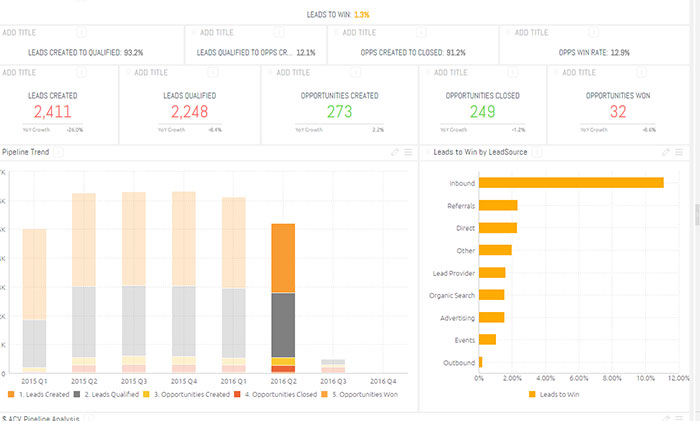
Leads to Win Analysis
Explore this dashboard
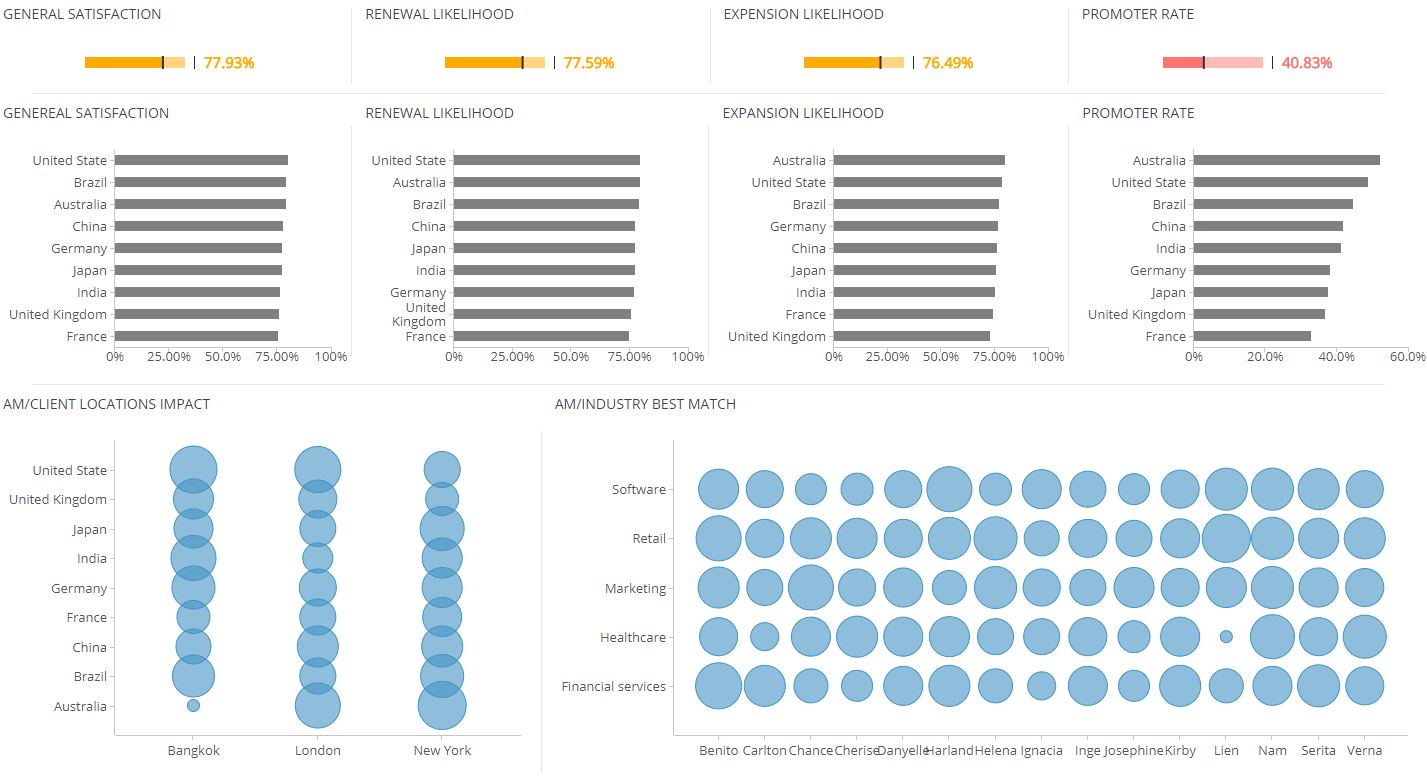
Customer Experience
Explore this dashboard