Outlier detection in SQL

- Blog
- BI Best Practices
Inevitably, the unexpected happens. A historically low-traffic channel brings in 10x the normal amount of users. Or your user login rate drops by half. In either case, these are important events that are easy to miss in a sea of…
Inevitably, the unexpected happens. A historically low-traffic channel brings in 10x the normal amount of users. Or your user login rate drops by half. In either case, these are important events that are easy to miss in a sea of data.
In this post we’ll cover a few SQL queries for detecting unusually high or low values in a set of data.
Static thresholds
We’ll start by using a static threshold in the query below to find rows above or below that threshold. This works well for key numbers that behave in predictable ways, and is trivial to implement.
Let’s define a with table of user data and see what it looks like:
with user_count as (
  select
    date_trunc('day', created_at)::date as day,
    count(1) as value
  from users
  group by 1
)
select * from user_count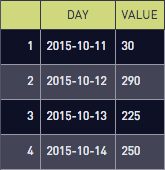
Let’s define outliers as any day with more than a thousand new users:
select *
from user_count
where value > 1000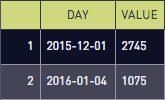
When we plot the outliers on top of the full data we see:
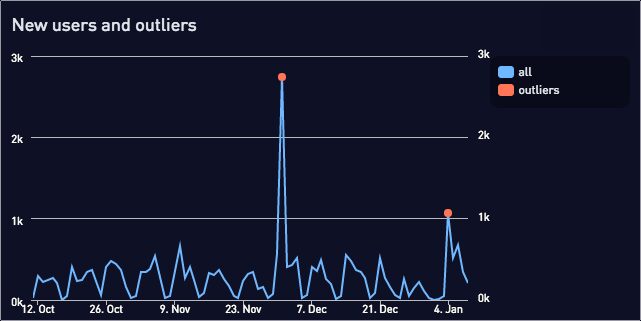
Static thresholds are simple and effective for basic use cases, but run into problems when data varies month to month and the old fixed threshold no longer applies.
Percentage thresholds
Percentage thresholds work well for data with a growth trend. A thousand new users per day may be unexpected in January, but typical by July.
With percentage thresholds, our alerts will continually adjust to recent trends. Rather than setting a threshold at a thousand new users, we can set one at 2x the current average.
First let’s add another with table to include the percentage difference vs. the mean for each data point:
with user_count as (
  select
    date_trunc('day', created_at)::date as day,
    count(1) as value
  from users
  group by 1
), user_count_with_pct as (
  select
    day,
    value,
    value / (avg(value) over ()) as pct_of_mean
  from user_count
  order by 1
)
select * from user_count_with_pct
The line value / (avg(value) over ()) uses a window function to divide each row’s value by the average value for the entire table. The results are:
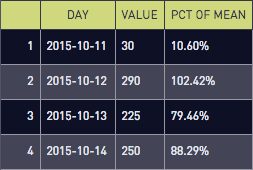
If we limit to outliers:
select *
from user_count_with_pct
where pct >= 2.0
We see the days where we had 200%+ of the average signup rate:
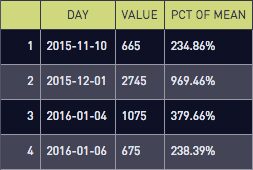
Plotted together:
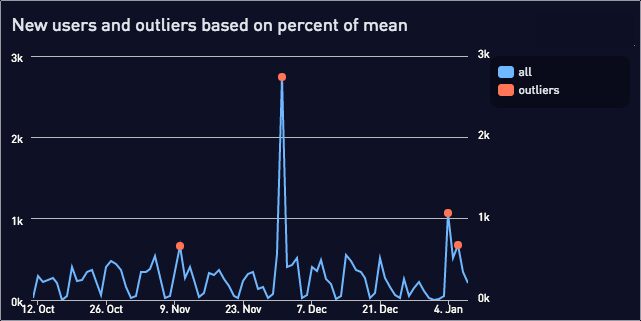
We could make this more robust by limiting the user_count table to just recent users. This prevents skewing the average with data from several months ago.
Standard deviation thresholds
While the percentage thresholds are flexible, they still manually picking the threshold. It would convenient if we had a query that would automatically pick a threshold for rare events.
Fortunately, we can use standard deviations. We can automatically define thresholds appropriate for data with either low variance (30% disk usage +/- 1%) or high variance (30% signup rate +/- 10%).
We then choose how sensitive we want to be to outliers. Do we want to detect events with a 5% chance, or a 0.1% chance? Additionally, we have to choose if we care about both high and low values (a two-tailed test), or just one of the two (a one-tailed test).
First, we need to pick a z score (number of standard deviations) threshold. This page from Boston University has a good explanation and z-scores for different probabilities.
For example, if we care about high or low values that occur only 5% of the time by random chance, we’d use a z score threshold of +/- 1.645. If we want a 5% threshold exclusively for high values, we’d pick 1.96.
Here’s the SQL for calculating z-scores for the low variance disk usage data:
with data as (
  select
    date_trunc('day', created_at)::date as day,
    count(1) as value
  from disk_usage
  group by 1
), data_with_stddev as (
  select
    day,
    value,
    (value - avg(value) over ())
     / (stddev(value) over ()) as zscore
  from data
  order by 1
)
select * from data_with_stddev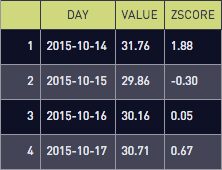
This is the same query as the percent threshold, but we calculate zscore instead of percent deviation from the mean. The first part of the calculation is (value – avg(value) over ()) which calculates how much a single datapoint deviates from the mean.
The second part / (stddev(value) over ()) divides the deviation by the standard deviation, to measure how many standard deviations the data point is from the mean.
Here’s the outlier query for a two-tailed 5% threshold:
select *
from data_with_stddev
where abs(zscore) >= 1.645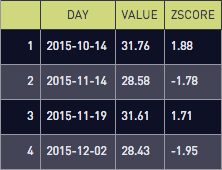
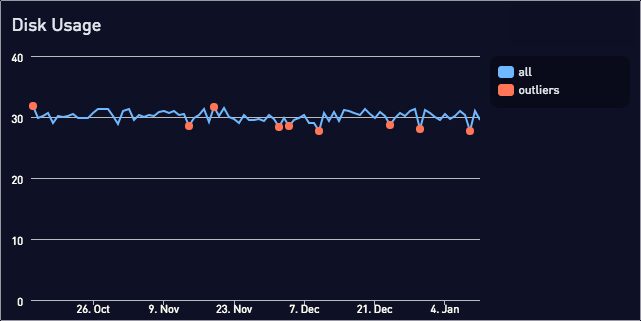
Plotting the disk usage data and outliers together:
And swapping in the high variance signup rate data:

We’ve applied the same standard deviation threshold to queries with very different data, and can still detect the outliers.
Well, that was unexpected!
We now have a few techniques for finding unusual results. Enjoy discovering the unpredictable in your data!


