Did you ever need to visualize data with different chart types, but realized that you were wasting valuable dashboard space?
How many times did viewers come with a demand to visualize the exact same data, but in different ways?
With the Paldi “Chart Type Switcher” you will supercharge your viewers and let them decide how to visualize the data.
One widget – many charts.
With an intuitive dropdown, viewers will have the ability to story-tell the data in the best way to meet their needs, while you save dashboard designer time and effort.
Key Highlights
- Can be used as a monetization strategy for OEM deployments
- Everything is completely dynamic and managed in the dashboard using our zero coding approach
- Performance booster for heavy dashboards
- Supports the capabilities of all existing charts
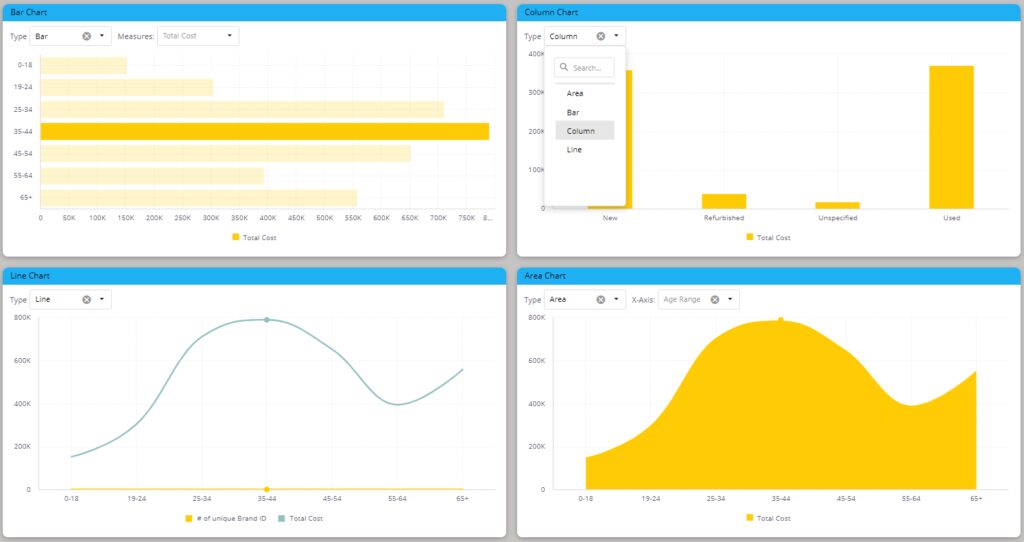
- The plugin supports column charts, bar charts, line charts and area charts
- No need for a sophisticated configuration file
Key Features
- An intuitive drop-down
- Easily managed within a dedicated widget
- Full integration with Paldi’s:
- Decide whether the viewer’s selection is persistent or not
See it in Action:
Screenshots
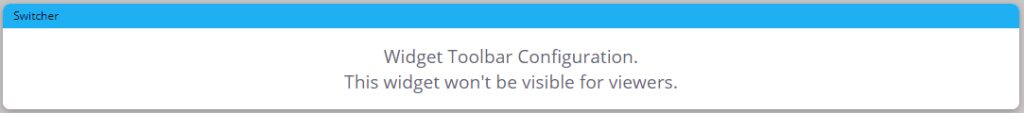
Chart Type Switcher widget:

Supported charts:

Contact us for a live demo and immediate free trial!
Simply send a request to [email protected]