KPI Explorer is a powerful tool that acts as the primary navigation element for your users to explore different KPIs across the same dashboard.
With the KPI Explorer you can:
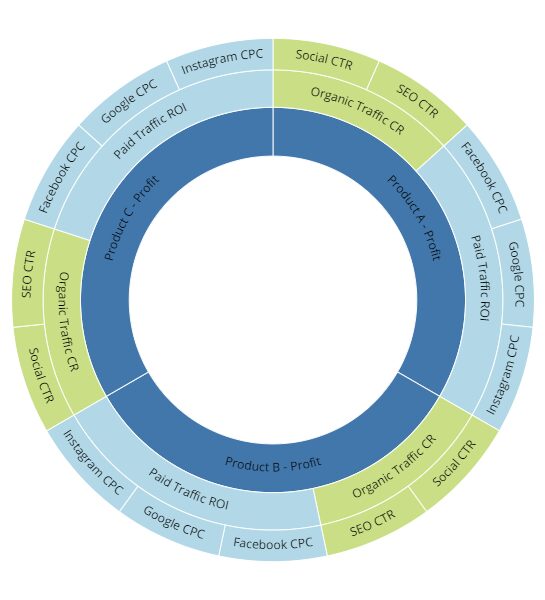
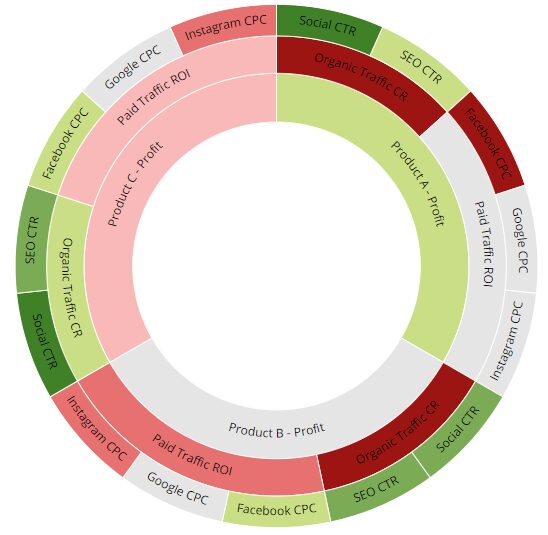
- Display KPIs hierarchy in a format similar to the SunBurst widget: Multi dimensional arcs, one for each KPI. Each arc in the widget shows a breakdown of its parent slice.
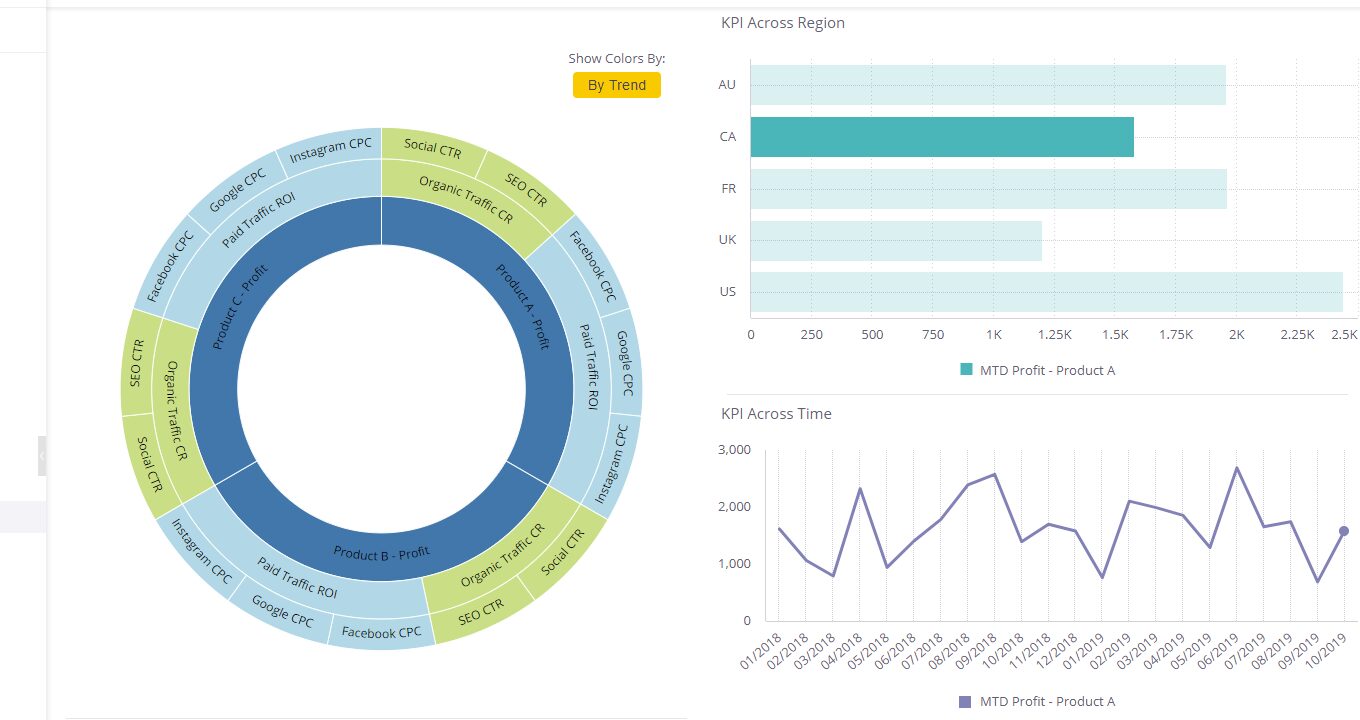
- Enable the user to focus the dashboard on a different KPI each time:
- Easy click to spotlight navigation
- Each widget in the dashboard is refreshed to present the chosen KPI as the main investigated measure of the graph
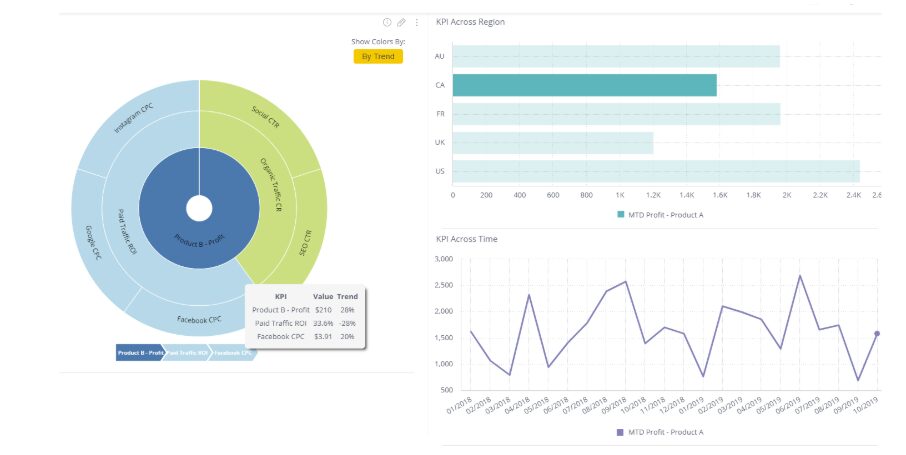
- Highlight trends to identify important changes: Toggle to present the KPI Explorer by trends coloring, to pop out important movements.
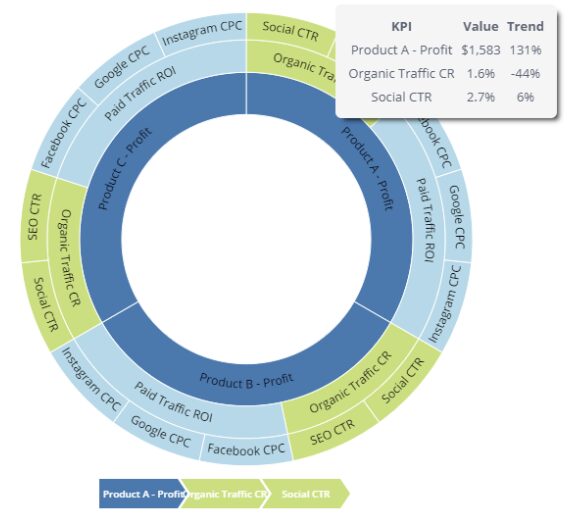
- Hover over each arc and see KPI value & trend, alongside the parent arcs values & trends.
See it in action:
How does it work?
1. Investigate KPIs hierarchy using the KPI Explorer :


2. Hover each KPI to see hierarchy, values & trends:

3. Click to explore chosen KPI:
Dashboard’s widgets will update to present the chosen KPI

4. Toggle to highlight KPI’s trends:

Paldi Solutions
There are many more fun functionalities this plugin enables. Contact us for a live demo and more information
Contact details: [email protected]
Website: paldi.solutions