Free
- Marketplace
Dashboard Toolbar
Read More
MARKETPLACE
By QBeeQ
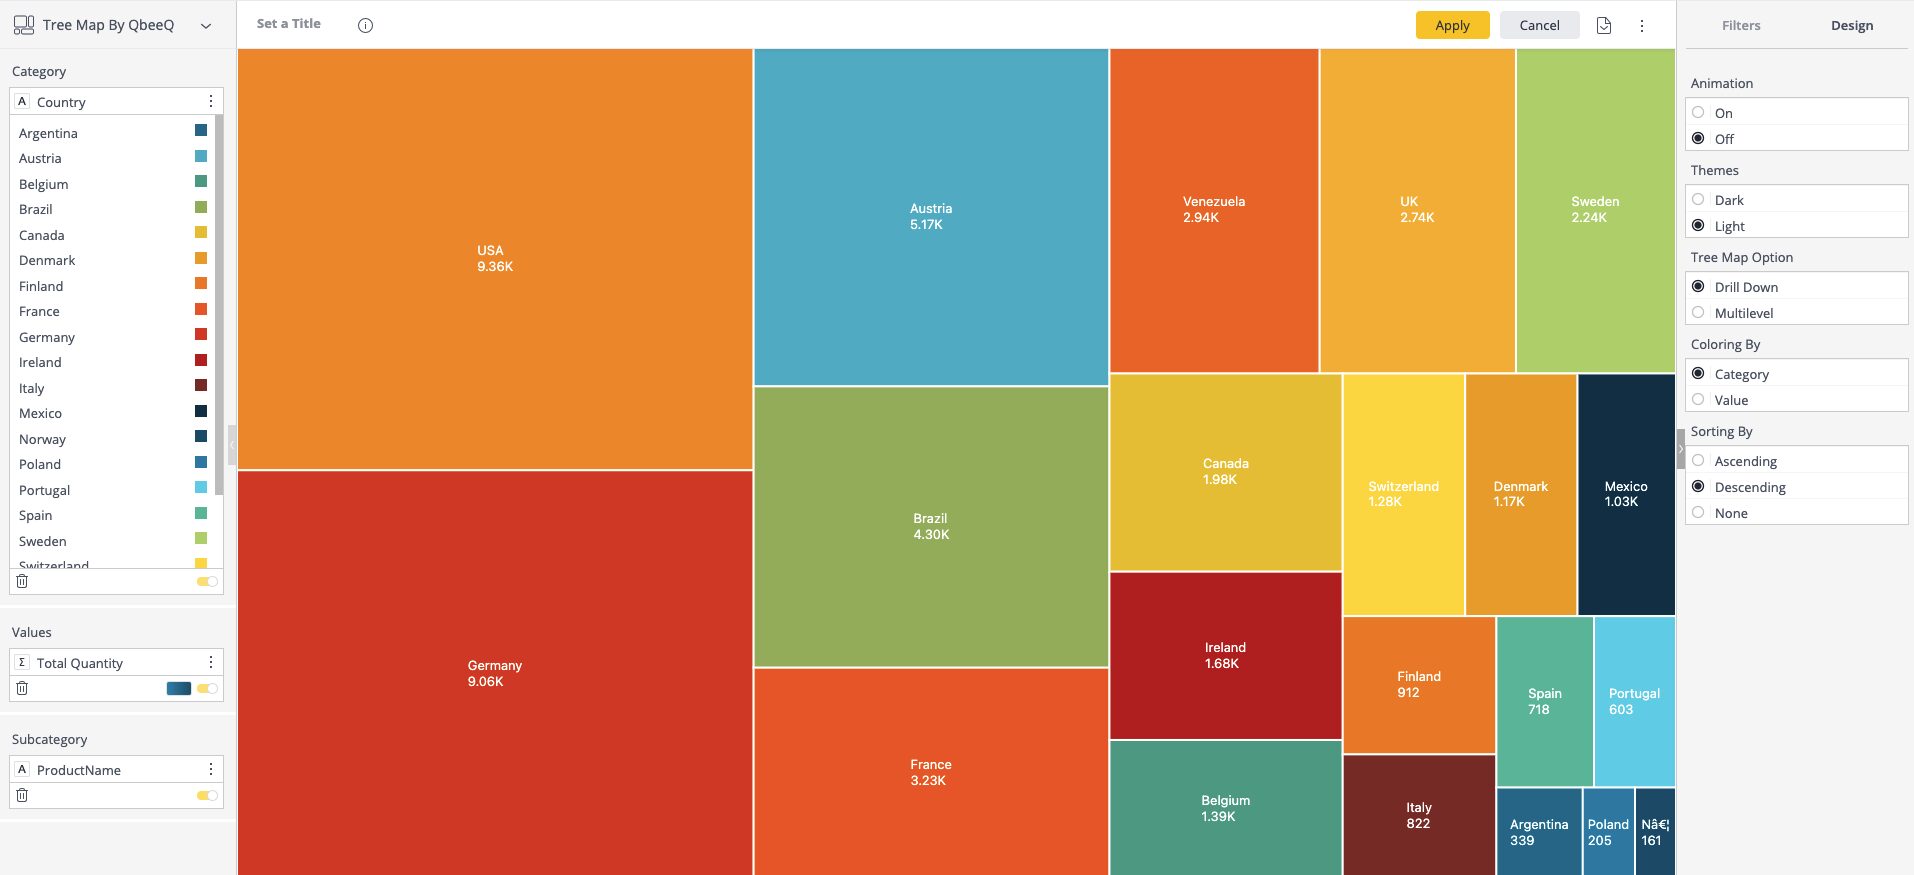
Treemaps display hierarchical (tree-structured) data as a set of nested rectangles. Each branch of the tree is given a rectangle, which is then tiled with smaller rectangles representing sub-branches. A leaf node’s rectangle has an area proportional to a specified dimension of the data.
This Multilevel Treemap enables you to drill down into another level of the data, or to constantly show both levels expanded.
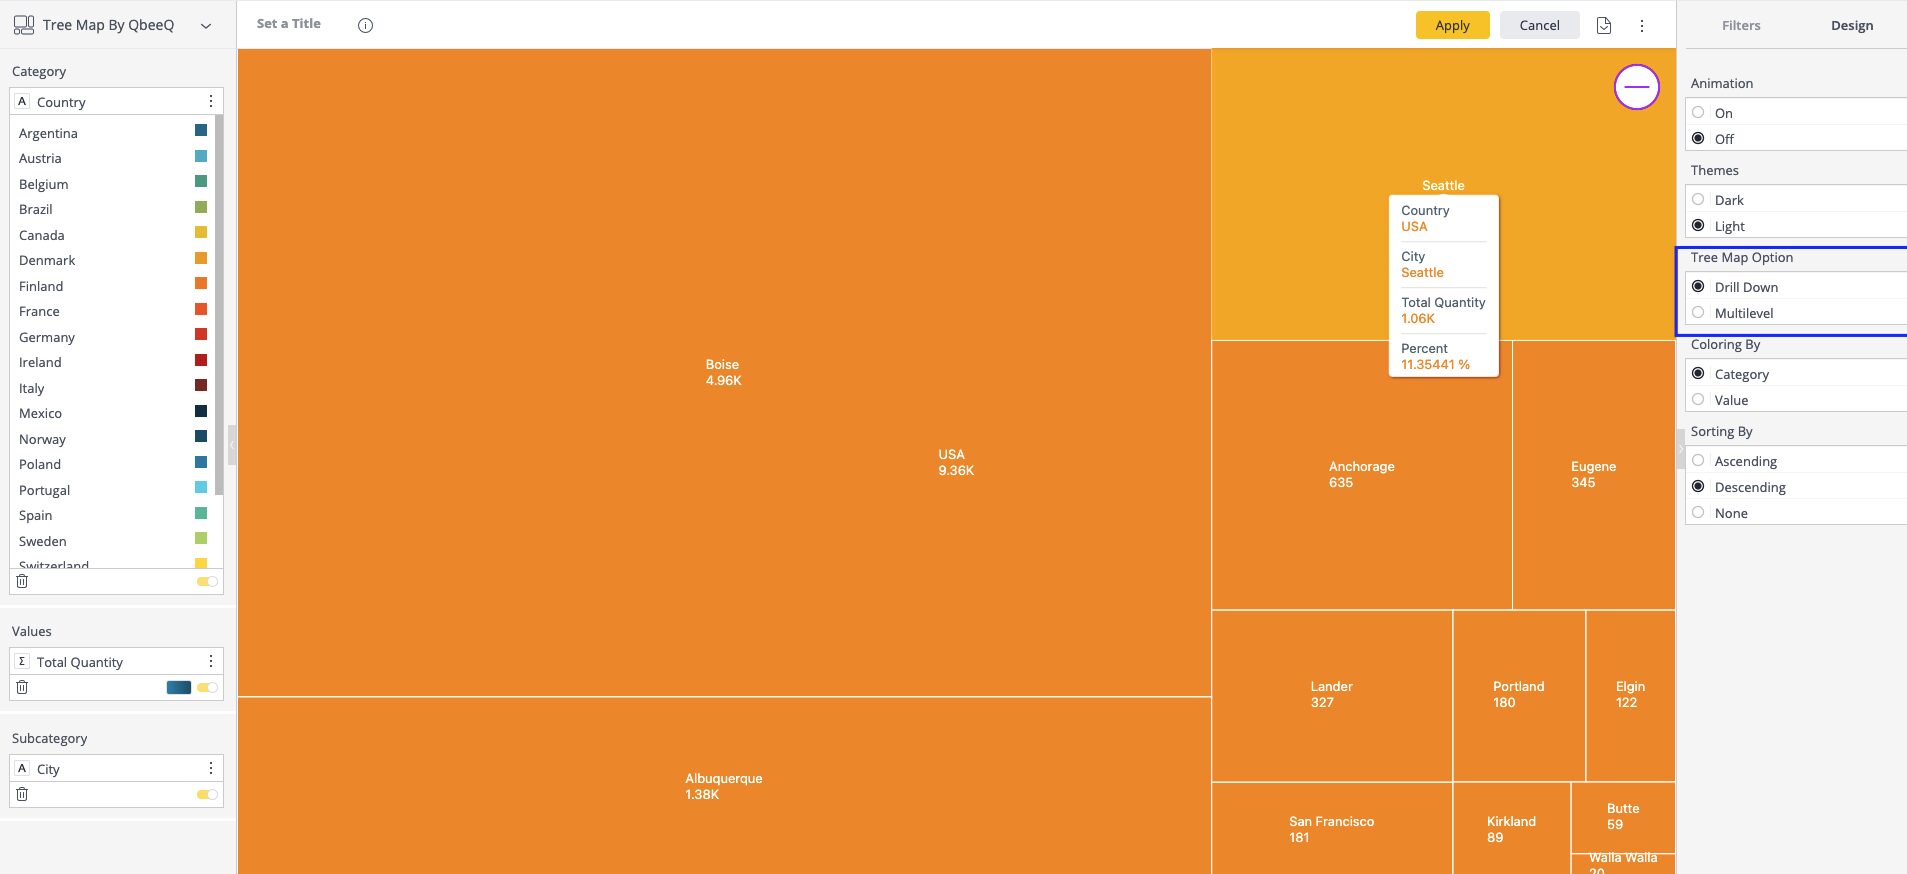
Once you click on any parent section, you can drill down into that subcategory. In this case, the cities in the US:
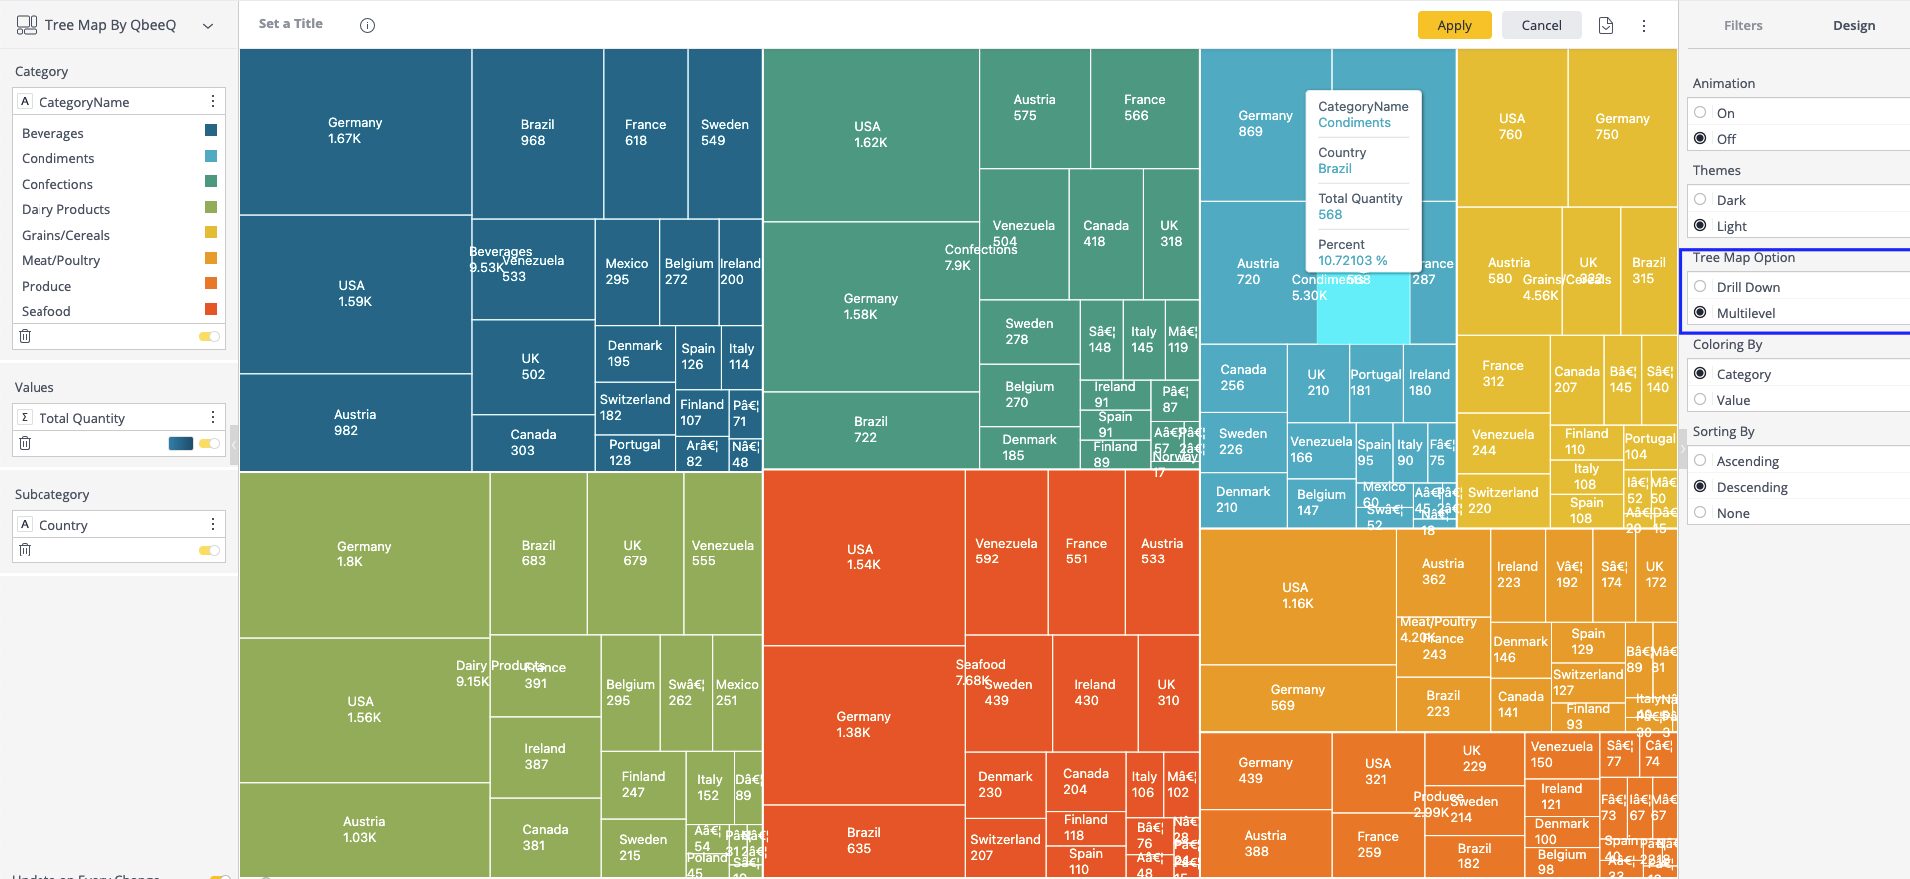
In the Multilevel view, the Treemap can be constantly expanded:
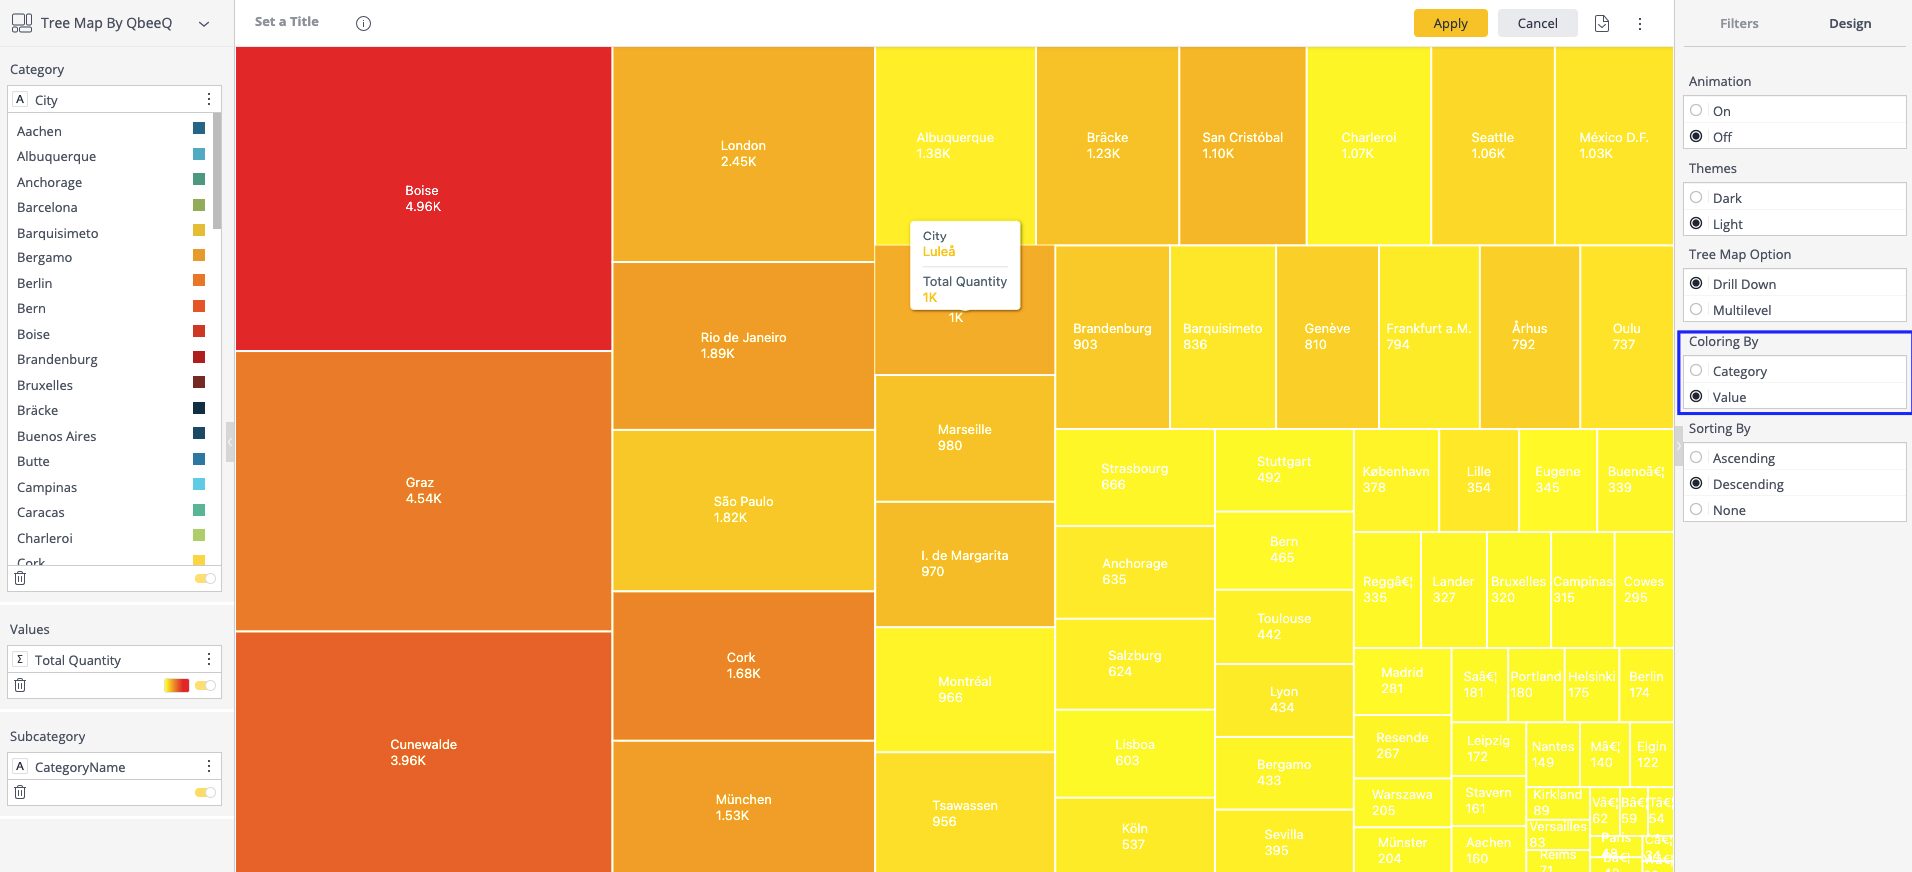
You can sort the sections, ascending or descending, and determine if the sections are to be colored by category (break by) or by KPI value:
Contact us for a live demo and free trial!