Premium
- Marketplace
Dashboard Filters
Read More
MARKETPLACE
By QBeeQ
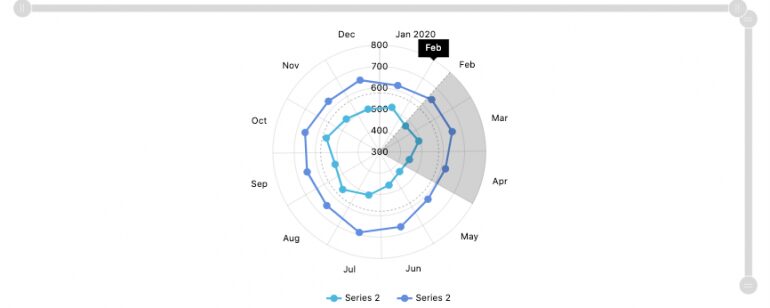
This beautified zoomable radial line graph (also known as a Polar line chart) is useful for displaying cyclical data of several series in a circular form:
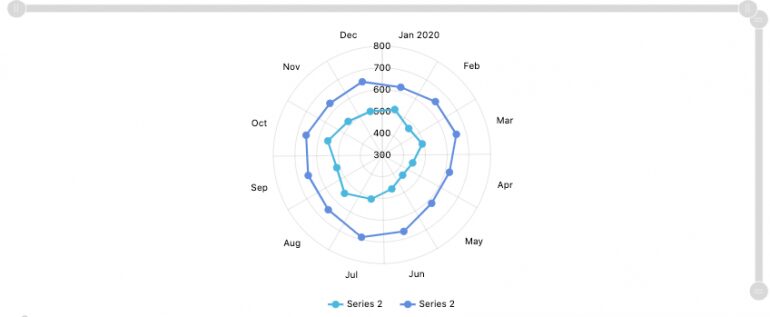
The Radial Line Graph comes with 2 zoomable axes, X and Y which enable zooming in upon 2 dimensions:
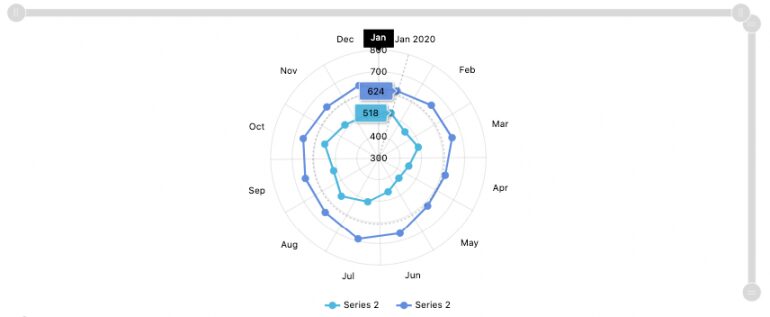
One can also use the mouse to further drill into the visualization for a more detailed view: